Setting Up Prometheus and Grafana for Server Monitoring
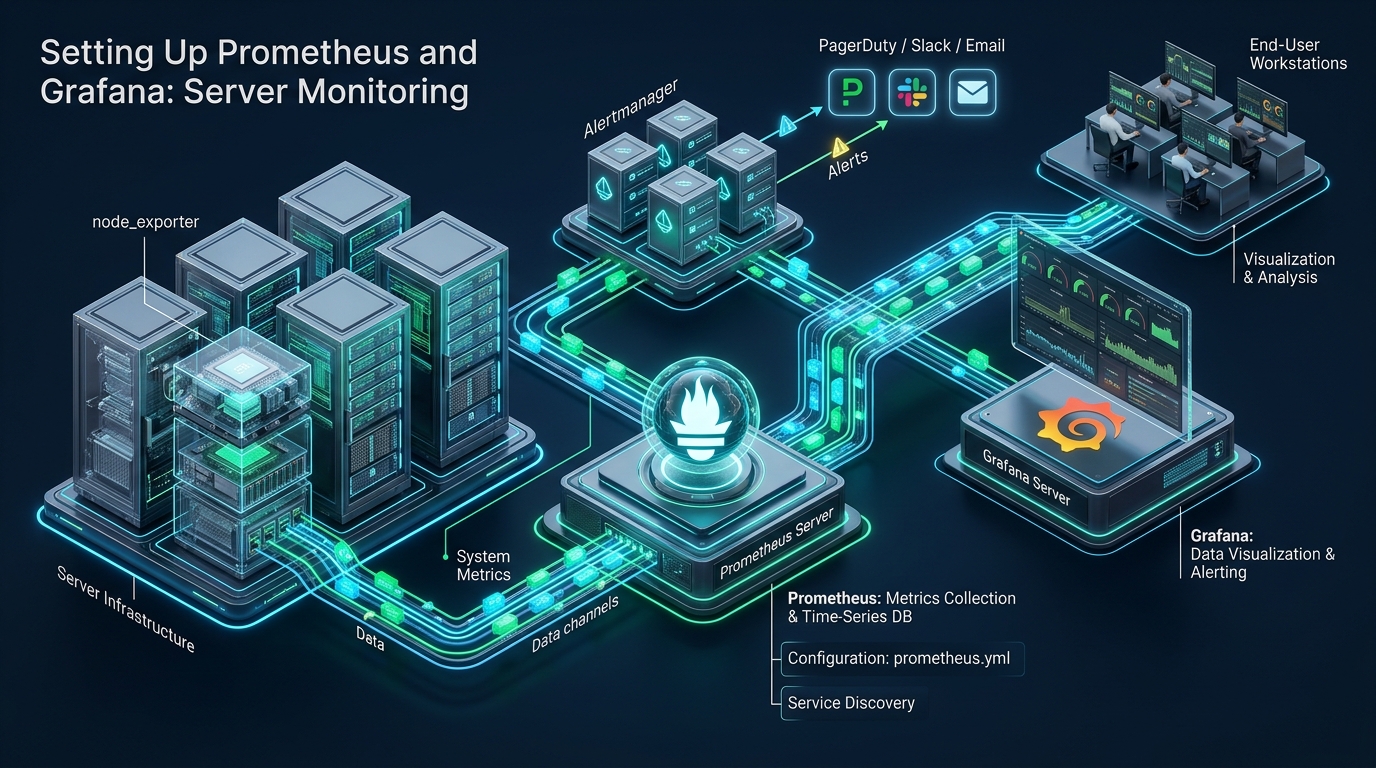
Deploy an enterprise Prometheus and Grafana server monitoring stack. Learn production TSDB sizing, Node Exporter hardening, and PromQL alerting.
 /BlogZero-Cost Cloud
Deploy an enterprise Prometheus and Grafana server monitoring stack. Learn production TSDB sizing, Node Exporter hardening, and PromQL alerting.

Harden Linux remote access with elliptic-curve Ed25519 cryptography and OATH-TOTP 2FA. Eliminate brute-force vectors and enforce zero-trust bastion security.

Deploy high-availability PostgreSQL streaming replication on Linux. Master primary-replica synchronization, replication slots, and failover.
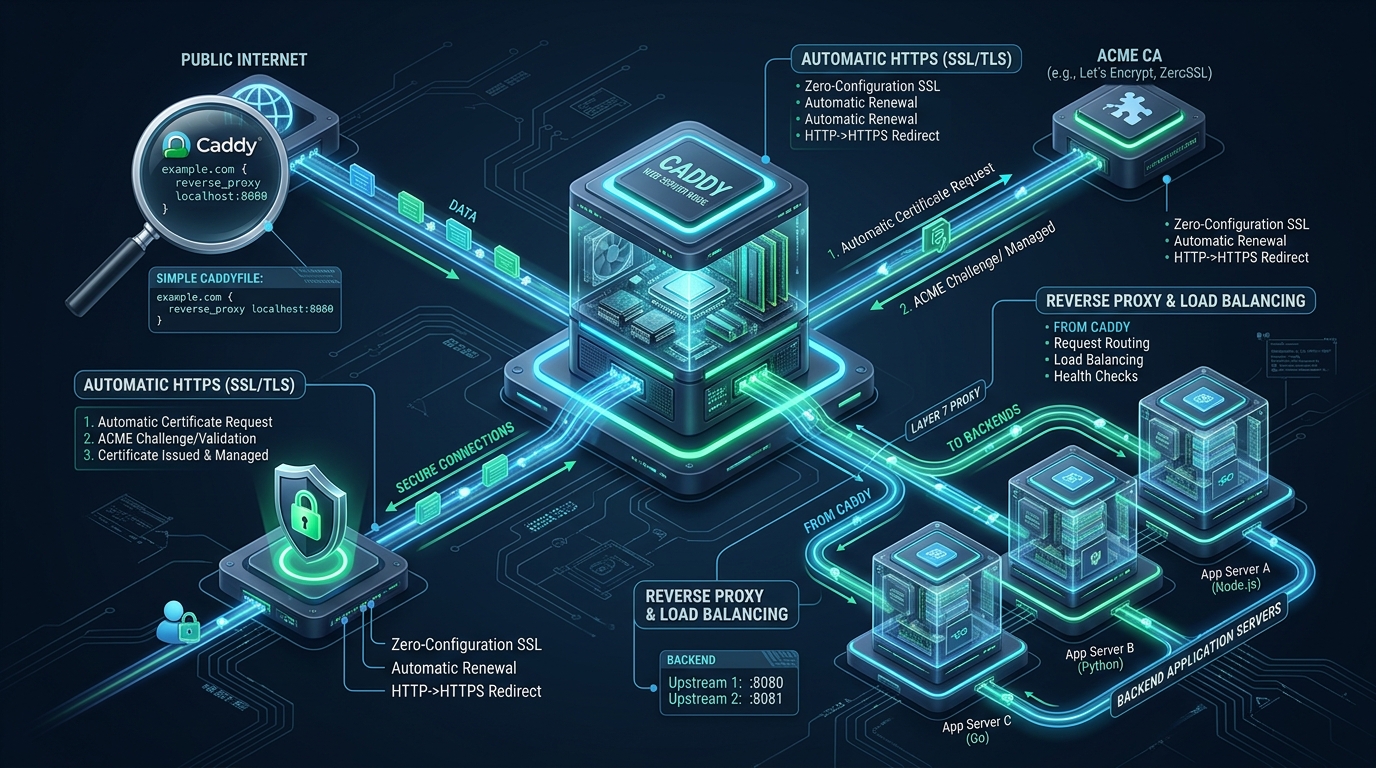
Master Caddy Web Server with this production tutorial. Learn zero-touch automatic HTTPS via ACME, high-concurrency reverse proxying, and kernel-level tuning.

Master enterprise high-availability Nginx load balancing with Keepalived VRRP failover, upstream tuning, SSL termination, and kernel network optimization.

Master enterprise rsync incremental backups using hard links (–link-dest). Step-by-step architecture, production scripts, systemd timers, and kernel tuning.

Master Linux awk text processing with real-world examples, log analytics pipelines, and benchmarked production scripts for high-throughput DevOps operations.
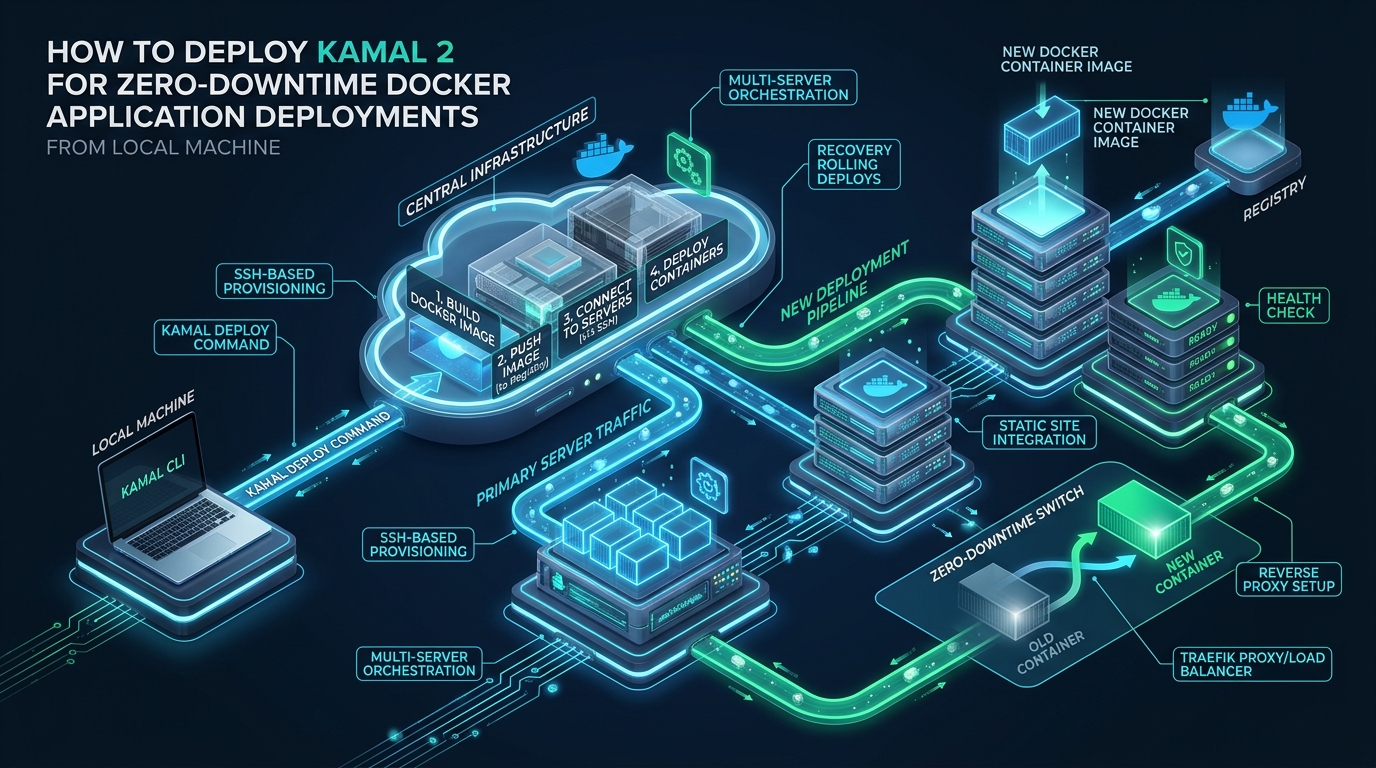
Deploy containerized workloads with zero downtime using Kamal 2 and kamal-proxy. Master local-to-production Docker releases without Kubernetes complexity.
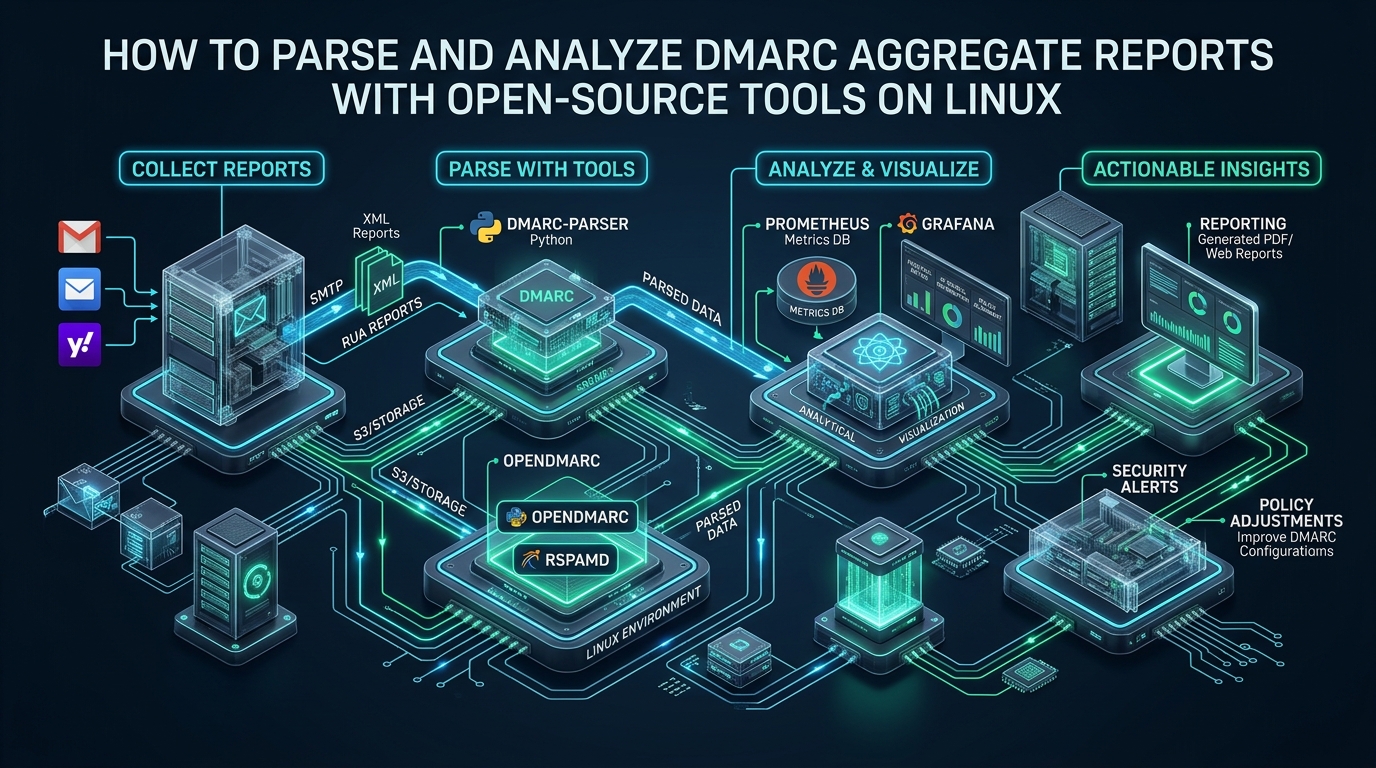
Parse and analyze DMARC aggregate XML reports on Linux using open-source engines. Automate ingestion, database storage, and Grafana deliverability dashboards.
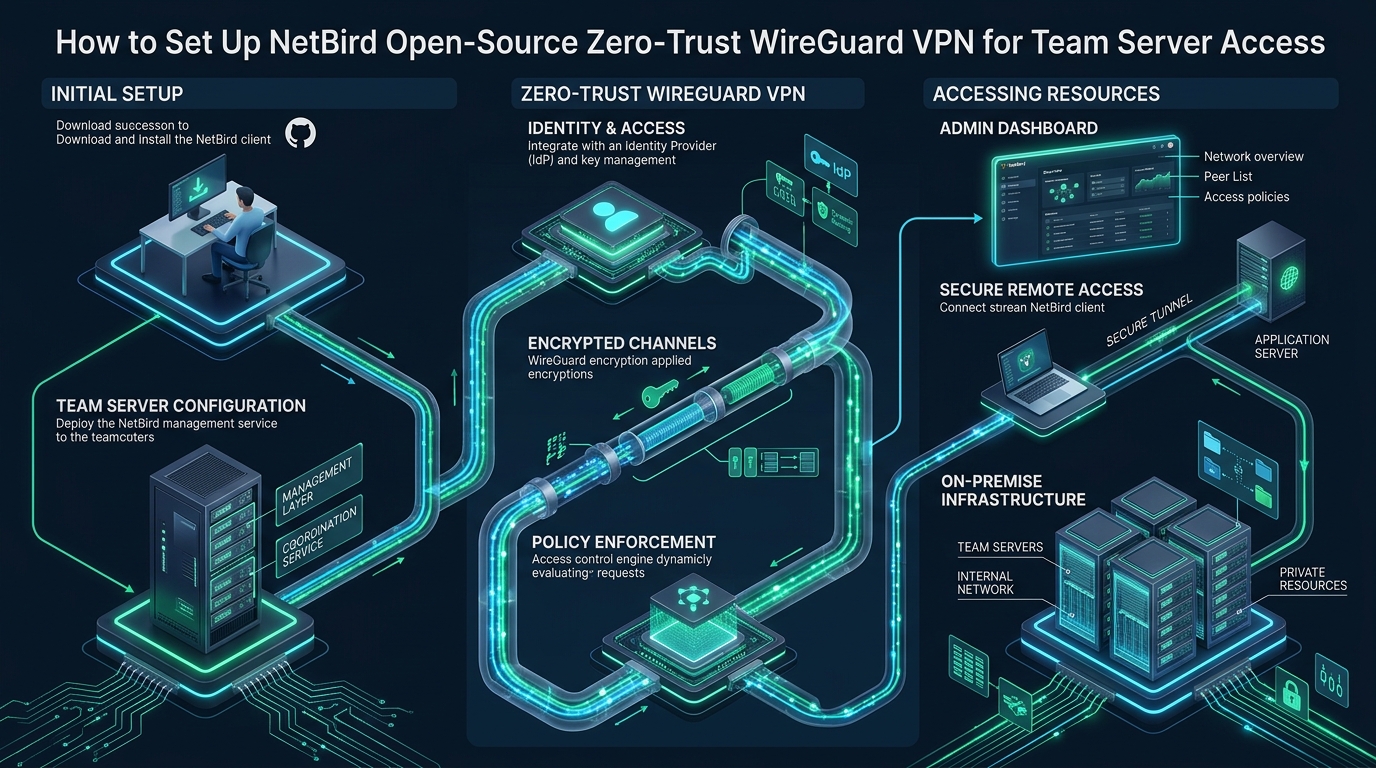
Deploy NetBird open-source zero-trust WireGuard VPN for secure team server access. Eliminate exposed SSH ports with peer-to-peer mesh overlays.