Configuring Uptime Kuma for Status Pages and Monitoring

Deploy an enterprise-grade Uptime Kuma setup for high-availability monitoring. Learn kernel tuning, SQLite WAL optimization, and resilient status pages.
 /BlogZero-Cost Cloud
Deploy an enterprise-grade Uptime Kuma setup for high-availability monitoring. Learn kernel tuning, SQLite WAL optimization, and resilient status pages.
Master Netdata installation on Linux for per-second observability. Configure dbengine v2, eBPF telemetry, and secure parent-child streaming architecture.

Master scalable log aggregation with Grafana Loki, Promtail, and Grafana. Reduce index bloat and build high-performance observability pipelines on Linux.
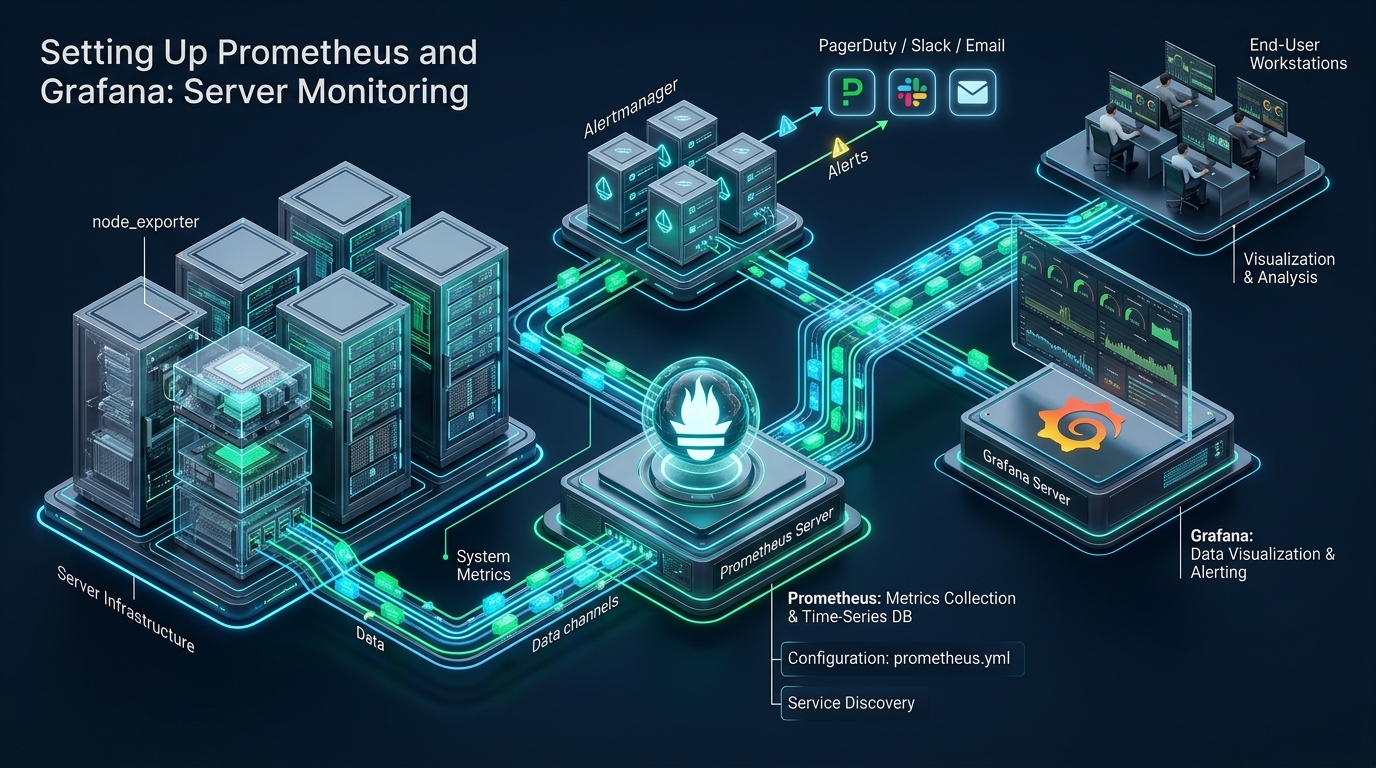
Deploy an enterprise Prometheus and Grafana server monitoring stack. Learn production TSDB sizing, Node Exporter hardening, and PromQL alerting.