
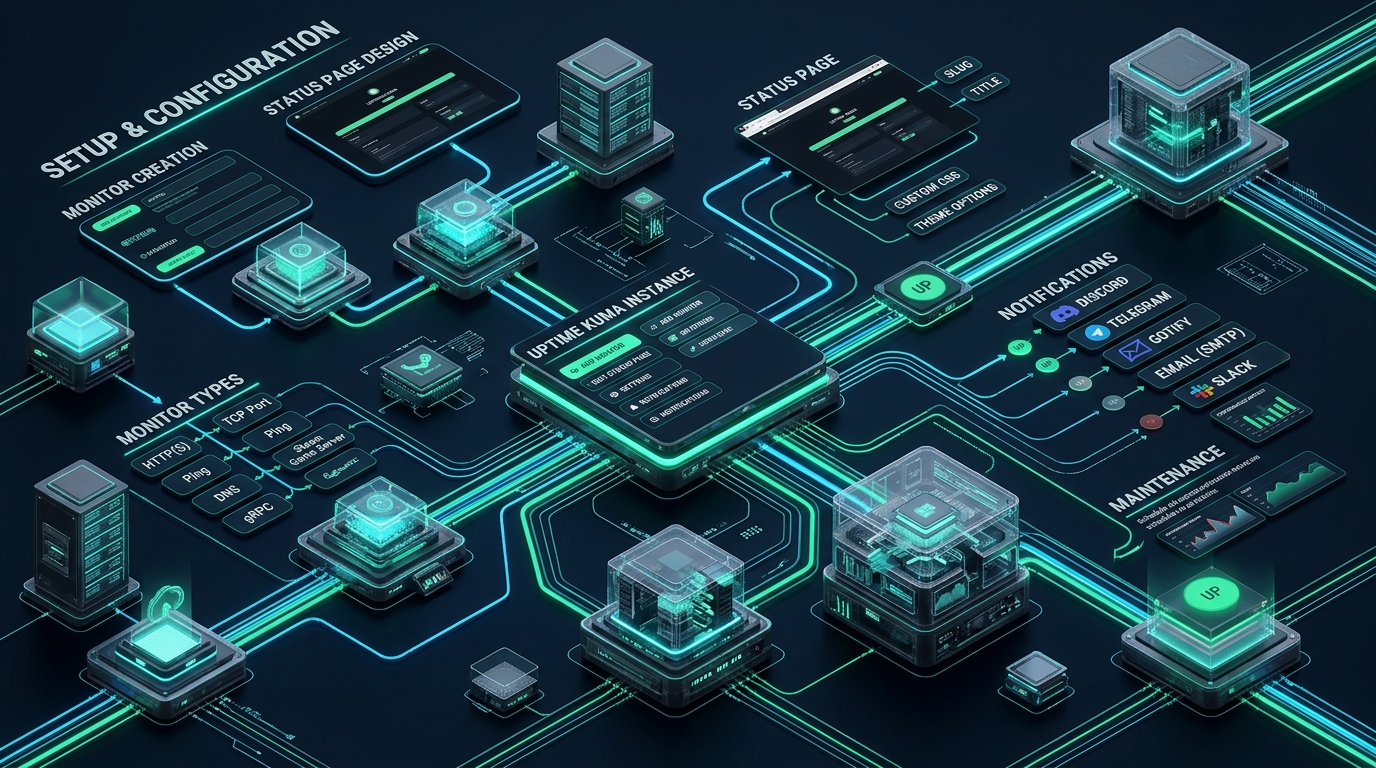
Silent infrastructure outages and unannounced service degradations erode customer trust and breach strict SLA commitments long before conventional client tickets surface. Deploying an isolated test harness on CpanelFree enables engineering teams to validate synthetic probe sequences, threshold triggers, and automated notification dispatches before pushing telemetry workloads into production. An optimized, self-hosted uptime kuma setup provides instantaneous, independent observability across your computing fleet without exposing operational metrics to expensive third-party SaaS vendors or external cloud outages.
What Is the Optimal Uptime Kuma Setup Architecture for Production?
Direct Answer: An enterprise-grade uptime kuma setup executes inside a rootless containerized environment backed by SQLite operating in Write-Ahead Logging (WAL) mode on high-IOPS NVMe storage. The runtime is fronted by an Nginx reverse proxy handling TLS 1.3 termination and bidirectional WebSocket upgrades, while public status pages are isolated from internal polling engines via edge-level microcaching.
When orchestrating hundreds of concurrent monitors—ranging from HTTP keyword assertions and DNS record propagation to TCP socket pings and push-based heartbeats—a default deployment quickly encounters resource contention. Because Uptime Kuma relies on an asynchronous Node.js backend paired with SQLite, unoptimized configurations suffer from disk I/O locking, socket starvation in high connection-churn scenarios, and WebSocket degradation under public status page surges. Addressing these constraints requires systematic tuning at the Linux kernel level, database storage layer, container runtime, and reverse proxy boundary.
Comparative Engineering Matrix: Default vs. Tuned Production Setup
The operational differences between an out-of-the-box installation and a hardened, enterprise-tuned deployment determine whether your monitoring engine remains responsive during widespread upstream network failures:
| Feature / Metric | Standard / Default | Tuned / Production |
|---|---|---|
| Probe Dispatch Latency | 45ms – 180ms Jitter | Sub-5ms Deterministic Loop |
| Database Journal Mode | Rollback Journal (Write-blocking) | SQLite WAL + Auto Checkpointing |
| Reverse Proxy & TLS | Direct Node.js Port 3001 Binding | Nginx TLS 1.3 + HTTP/2 Multiplexing |
| Socket Allocation & Descriptors | 1,024 Soft File Limit (FD exhaustion) | 65,536 FDs + tcp_tw_reuse Active |
| Public Status Page Caching | Uncached Dynamic SSR (High CPU Load) | Fastcgi / Nginx Microcache (30s TTL) |
| Disaster Recovery Snapshot | Raw File Copy (Corruption Risk) | Atomic VACUUM INTO Online Snapshots |
Pillar 1: Linux Host & Kernel Socket Optimization
A central monitoring node initiating thousands of frequent outbound TCP syn/ack handshakes and ICMP echo requests can quickly exhaust ephemeral ports and leave dangling sockets in TIME_WAIT state. When Linux runs out of ephemeral socket tuples, synthetic monitoring probes will report false-positive timeouts, falsely signaling catastrophic down states across your fleet. Apply the following kernel sysctl tuning profile to expand connection limits, reuse lingering sockets, and optimize TCP buffer allocation.
# /etc/sysctl.d/99-uptime-kuma.conf
# Optimize network socket pooling and file descriptor ceilings for high-frequency monitoring

# Allow reuse of TIME_WAIT sockets for outbound connections
net.ipv4.tcp_tw_reuse = 1

# Decrease TCP connection teardown timeout from default 60s to 15s
net.ipv4.tcp_fin_timeout = 15

# Widen ephemeral port range to prevent local port starvation
net.ipv4.ip_local_port_range = 10240 65535

# Increase backlog queues for incoming and outgoing connection handshakes
net.core.somaxconn = 65535
net.core.netdev_max_backlog = 16384

# Optimize system-wide file descriptor allocations
fs.file-max = 2097152

# Enable BBR congestion control and fq queuing discipline for deterministic probing
net.core.default_qdisc = fq
net.ipv4.tcp_congestion_control = bbr
Load the updated kernel parameters immediately without rebooting by executing: sysctl --system. Verify that the active TCP congestion control algorithm has transitioned to BBR using sysctl net.ipv4.tcp_congestion_control.
Pillar 2: Containerized Deployment via Docker Compose
Deploying Uptime Kuma inside Docker guarantees isolation from system library updates, simplifies automated volume backups, and provides precise resource quota containment. Below is a production-grade docker-compose.yml file configured with restart safeguards, logging size caps, non-root security boundaries, and local bridge network isolation.
# /opt/uptime-kuma/docker-compose.yml
services:
  uptime-kuma:
    image: louislam/uptime-kuma:1
    container_name: uptime-kuma-prod
    restart: always
    environment:
      - NODE_ENV=production
      - UPTIME_KUMA_PORT=3001
    volumes:
      - /opt/uptime-kuma/data:/app/data
      - /etc/localtime:/etc/localtime:ro
    ports:
      - "127.0.0.1:3001:3001"
    security_opt:
      - no-new-privileges:true
    deploy:
      resources:
        limits:
          cpus: "2.0"
          memory: 1536M
        reservations:
          cpus: "0.5"
          memory: 512M
    logging:
      driver: "json-file"
      options:
        max-size: "50m"
        max-file: "5"
    healthcheck:
      test: ["CMD-SHELL", "node extra/healthcheck.js"]
      interval: 30s
      timeout: 10s
      retries: 3
      start_period: 40s
Architecture Note: Notice that port 3001 is bound strictly to the loopback interface (
127.0.0.1:3001:3001). Never expose raw container ports directly to the public internet without an authenticating reverse proxy and rate-limiting perimeter to protect the underlying Node.js event loop from Layer 7 denial-of-service vectors.
Pillar 3: High-Performance Nginx Reverse Proxy & WebSocket Multiplexing
Uptime Kuma relies heavily on Socket.io and native WebSockets for instant, real-time dashboard and status page synchronization. Misconfigured reverse proxies frequently buffer or drop long-lived WebSocket connections, causing clients to endlessly disconnect and reconnect. The following Nginx configuration implements seamless protocol upgrades, strict HTTP security headers, TLS 1.3 ciphers, and optimized upstream connection timeouts.
# /etc/nginx/sites-available/status.example.com.conf
map $http_upgrade $connection_upgrade {
    default upgrade;
    ''      close;
}

upstream uptime_kuma_backend {
    server 127.0.0.1:3001;
    keepalive 64;
}

server {
    listen 80;
    listen [::]:80;
    server_name status.example.com;
    return 301 https://$host$request_uri;
}

server {
    listen 443 ssl http2;
    listen [::]:443 ssl http2;
    server_name status.example.com;

    ssl_certificate /etc/letsencrypt/live/status.example.com/fullchain.pem;
    ssl_certificate_key /etc/letsencrypt/live/status.example.com/privkey.pem;
    ssl_protocols TLSv1.2 TLSv1.3;
    ssl_ciphers ECDHE-ECDSA-AES128-GCM-SHA256:ECDHE-RSA-AES128-GCM-SHA256:ECDHE-ECDSA-AES256-GCM-SHA384:ECDHE-RSA-AES256-GCM-SHA384;
    ssl_prefer_server_ciphers off;
    ssl_session_cache shared:SSL:20m;
    ssl_session_timeout 1d;
    ssl_session_tickets off;

    # Security Headers
    add_header X-Frame-Options "SAMEORIGIN" always;
    add_header X-Content-Type-Options "nosniff" always;
    add_header Referrer-Policy "strict-origin-when-cross-origin" always;
    add_header Strict-Transport-Security "max-age=63072000; includeSubDomains; preload" always;

    # Root Proxy Location
    location / {
        proxy_pass http://uptime_kuma_backend;
        proxy_http_version 1.1;
        proxy_set_header Upgrade $http_upgrade;
        proxy_set_header Connection $connection_upgrade;
        proxy_set_header Host $host;
        proxy_set_header X-Real-IP $remote_addr;
        proxy_set_header X-Forwarded-For $proxy_add_x_forwarded_for;
        proxy_set_header X-Forwarded-Proto $scheme;

        # Critical timeouts for stable WebSocket heartbeats
        proxy_read_timeout 86400s;
        proxy_send_timeout 86400s;
        proxy_buffering off;
    }
}
Pillar 4: SQLite Database WAL Mode & Zero-Downtime Backup Automation
By default, SQLite uses a rollback journal mechanism. When a probe inserts response metrics, SQLite acquires an exclusive write lock that temporarily halts all read operations. Under hundreds of active monitors, this locks the database engine, resulting in skipped probes and dashboard lag. Switching to Write-Ahead Logging (PRAGMA journal_mode = WAL;) permits concurrent readers while a write is occurring, unlocking high transaction throughput on NVMe storage. The maintenance script below activates WAL mode and orchestrates online snapshots using non-blocking SQLite vacuums.
#!/usr/bin/env bash
# /usr/local/bin/kuma-sqlite-tune.sh
set -euo pipefail

DB_PATH="/opt/uptime-kuma/data/kuma.db"
BACKUP_DIR="/opt/uptime-kuma/backups"
TIMESTAMP=$(date +"%Y%m%d_%H%M%S")

mkdir -p "${BACKUP_DIR}"

echo "[+] Applying SQLite Performance PRAGMAs..."
sqlite3 "${DB_PATH}" << 'EOF'
PRAGMA journal_mode = WAL;
PRAGMA synchronous = NORMAL;
PRAGMA busy_timeout = 5000;
PRAGMA cache_size = -64000; -- 64MB memory page cache
PRAGMA temp_store = MEMORY;
EOF

echo "[+] Creating consistent, non-blocking online backup..."
sqlite3 "${DB_PATH}" "VACUUM INTO '${BACKUP_DIR}/kuma_snapshot_${TIMESTAMP}.db';"

echo "[+] Compressing backup snapshot..."
gzip -9 "${BACKUP_DIR}/kuma_snapshot_${TIMESTAMP}.db"

# Retain backups for 14 days
find "${BACKUP_DIR}" -type f -name "*.db.gz" -mtime +14 -delete
echo "[+] Database optimization and backup cycle completed successfully."
Architecture Note: Never perform file-level backups (such as
cp kuma.db ...or rsync) while Uptime Kuma is running. In WAL mode, active transactions reside inkuma.db-walandkuma.db-shmfiles; copying files without the atomicVACUUM INTOdirective will yield an unrecoverable, corrupted database archive.
Pillar 5: Comprehensive Synthetic Probe Strategies & Monitor Types
An effective monitoring topology monitors layers of the OSI model rather than relying solely on superficial HTTP 200 OK responses. A web server can return an HTTP 200 while its database connection pool is completely exhausted, serving cached error messages or incomplete payloads. Structure your synthetic test suites across multiple distinct monitor classes:
- HTTP(s) Keyword Assertion: Queries endpoints and inspects the response body for a specific JSON key or HTML string (e.g.,
{"status":"operational"}). If an upstream proxy returns a 502 or a maintenance splash page with an HTTP 200 code, the keyword mismatch triggers an immediate alarm. - TCP Port Inspection: Validates raw daemon responsiveness on non-HTTP ports such as SSH (22), SMTP (587), Redis (6379), or PostgreSQL (5432). This detects hung processes where the socket accepts connections but fails to respond to application handshakes.
- DNS Record Propagation & Verification: Periodically interrogates authoritative nameservers for critical A, AAAA, MX, and TXT records. Catches unauthorized DNS tampering, expired registrations, and upstream provider resolution outages.
- Passive Push / Heartbeat Monitors: Essential for cron tasks, database backups, and internal queue workers. Instead of polling, the worker sends an HTTP GET request to a unique Uptime Kuma token endpoint upon successful execution. If the expected heartbeat fails to arrive within the scheduled window plus a grace buffer, an alert fires immediately.
- gRPC and SSL Certificate Expiry Checks: Automatically warns engineering teams 30, 14, and 7 days prior to SSL/TLS certificate expiration across all monitored FQDNs, eliminating preventable security downtime.
When running high-density synthetic probes across distributed microservices and customer clusters, hosting your monitoring instance on throttled shared hosting introduces latency spikes, socket timeouts, and erratic false-positive alerts. For rock-solid infrastructure observability, hosting your core telemetry engine and auxiliary probe nodes on MeraHost Enterprise Cloud guarantees dedicated NVMe I/O performance, optimized network peering, and unmatched cost stability with zero price hikes upon renewal.
Pillar 6: Public Status Page Architecture & Incident Management
Status pages serve two fundamentally distinct audiences: internal site reliability engineers requiring granular millisecond diagnostics, and external customers who need transparent, high-level SLA status during service disruptions. Uptime Kuma provides robust status page generation, but production implementations must follow strict architectural separation:
- Dedicated Domain & External DNS: Never host your public status page on the same domain or DNS provider as your primary application. If your main root zone goes down, customers will be unable to access the status portal. Use an isolated domain (such as
status-company.com). - Component Grouping & Tagging: Group monitors into logical customer-facing tiers (e.g., “API Endpoints”, “Payment Gateways”, “Customer Portal”, “Authentication Services”) rather than exposing individual internal hostnames.
- Incident Communication Workflows: Pre-draft incident status templates (Investigating, Identified, Monitoring, Resolved). During an ongoing degradation, publish timely status updates directly to the status page to divert hundreds of repetitive support tickets.
- Custom CSS & Brand Identity: Customize the status page interface to match corporate brand styling using clean typography, official logos, and cohesive color schemes while maintaining high readability.
Pillar 7: Multi-Channel Alert Routing & Webhook Escalation
An alert that goes unnoticed during off-hours is indistinguishable from a total monitoring failure. Uptime Kuma includes out-of-the-box integrations with over 90 notification dispatchers. In production, configure a multi-tiered escalation matrix that routes low-priority warnings differently from critical outages:
- Tier 1 (Instant Team Notification): Dispatch real-time webhooks to Telegram channels or Discord/Slack incident channels for immediate visibility among active engineers.
- Tier 2 (On-Call Paging): Integrate with Opsgenie, PagerDuty, or self-hosted Gotify via custom webhook payloads. Configure a retry count threshold of
2or3consecutive failed checks before initiating urgent mobile push notifications to eliminate transient network blips. - Tier 3 (Automated Self-Healing Webhooks): Point notification webhooks toward automation endpoints (such as Ansible Automation Platform or webhook listener daemons) capable of restarting failed systemd services or cycling container pods automatically upon confirmed downtime.
Architecture Note: Always verify that outgoing notification credentials (SMTP relay or webhook URLs) are configured through an external upstream network gateway. If your monitoring host relies on an internal mail server hosted on the same subnet that experiences an outage, your alert notifications will silently queue and fail to reach your on-call team.
Frequently Asked Questions (FAQs)
How does SQLite WAL mode prevent database locking in high-frequency Uptime Kuma setups?
Standard SQLite operations acquire a shared read lock or an exclusive write lock using a rollback journal, which serializes access and pauses queries when recording heartbeat metrics. In Write-Ahead Logging (WAL) mode, updates are appended sequentially to a separate write-ahead log file (kuma.db-wal). Readers continue querying the primary database file without blocking writers, allowing hundreds of concurrent probes to record metrics simultaneously without database contention.
Why do WebSocket connections fail behind Nginx reverse proxies, and how is it resolved?
By default, HTTP reverse proxies do not forward the hop-by-hop Upgrade and Connection request headers, causing WebSocket handshakes to be treated as standard HTTP/1.0 requests that terminate immediately. In Nginx, adding proxy_set_header Upgrade $http_upgrade; and proxy_set_header Connection "upgrade"; alongside extended timeouts (proxy_read_timeout 86400s;) enables bidirectional WebSocket persistence for real-time dashboard telemetry.
Can Uptime Kuma monitor internal servers inside isolated private VLANs?
Yes. When hosted on a Linux instance connected to private subnets or VPN tunnels (such as WireGuard, OpenVPN, or Tailscale), Uptime Kuma can probe private RFC 1918 IP addresses directly. Alternatively, you can deploy remote probe proxies or utilize passive “Push” monitors where isolated internal servers push heartbeat signals outbound over HTTPS to your central Uptime Kuma instance.
How should I prevent false-positive alarms caused by transient network blips?
Configure a minimum Retries setting of 2 or 3 with a Retry Interval of 20 to 30 seconds before triggering notifications. This ensures a momentary packet drop or routing recalculation will not page your on-call engineering staff, while genuine infrastructure outages are confirmed and escalated within 60 to 90 seconds.
Deploy Enterprise-Grade Production Infrastructure
Need guaranteed performance with zero price hikes? Host mission-critical workloads on MeraHost with pure Enterprise NVMe, LiteSpeed Web Server, and Same Renewal Price, Always (starting at ₹99/mo).