
When distributed web applications experience intermittent latency spikes, silent packet drops, or socket pool starvation during peak traffic surges, legacy diagnostics like netstat and ifconfig fail due to prohibitive userspace /proc parsing overhead and obsolete ioctl interfaces. Modern Linux network troubleshooting requires low-overhead, deterministic tooling built directly on kernel Netlink sockets and socket monitoring APIs to isolate bottlenecks in real time. At CpanelFree, our system engineers standardize on modern kernel-native utilities to validate staging environments, streamline multi-tenant traffic routing, and eradicate packet anomalies before customer-facing workloads degrade.
Enterprise Linux Network Troubleshooting Architecture
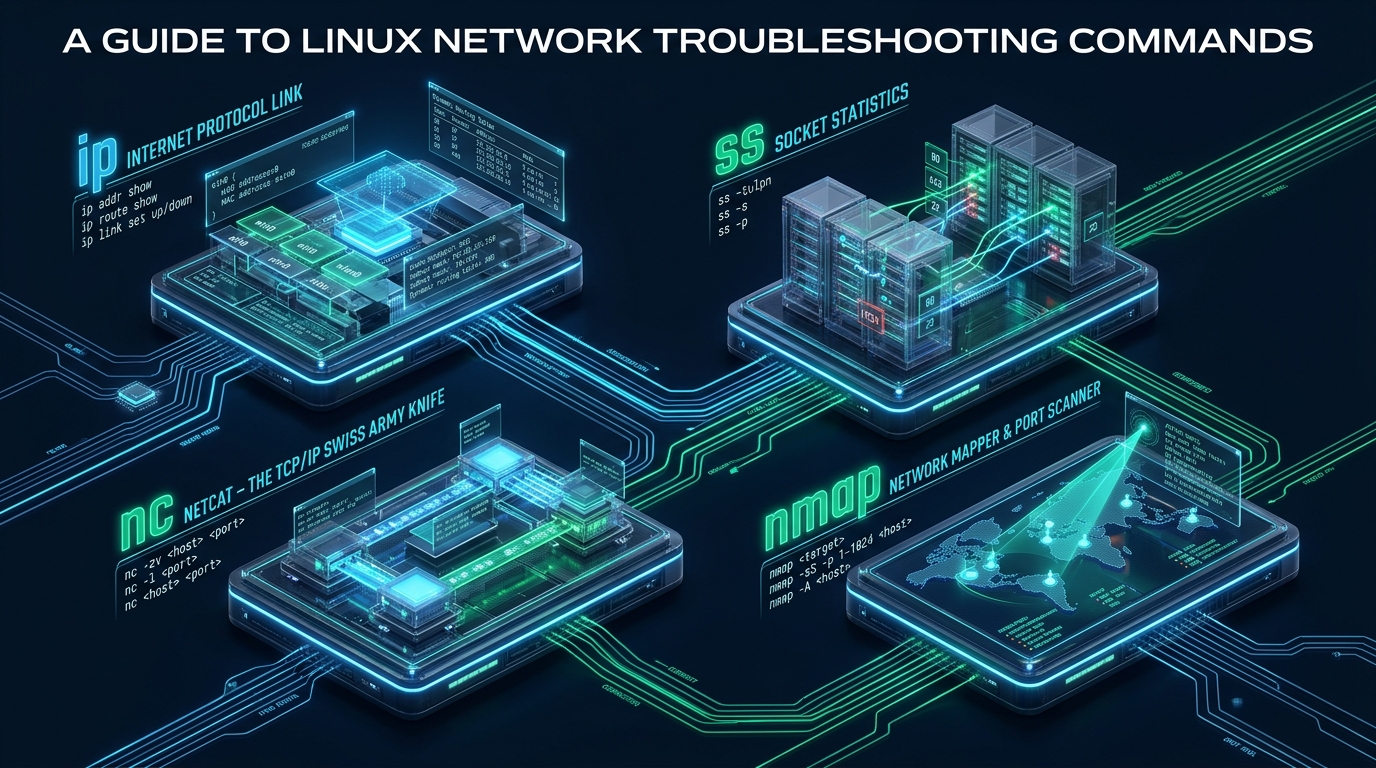
Direct Answer: Modern Linux network troubleshooting relies on four core utilities: ip (manages link states, addresses, and routing via kernel Netlink), ss (inspects socket buffers and TCP states via sock_diag without procfs overhead), nc (tests transport-layer TCP/UDP connectivity and port listening), and nmap (executes stealth scans and service auditing across network topologies).
Diagnosing network degradation in enterprise Linux clusters demands an understanding of the boundary between the Linux kernel network stack and userspace inspection utilities. Older utilities from the net-tools suite (including ifconfig, route, arp, and netstat) communicate with the kernel through legacy ioctl system calls (such as SIOCGIFCONF) and by reading formatted text records line-by-line from the virtual filesystem at /proc/net/dev and /proc/net/tcp. Under production workloads with tens of thousands of active TCP sessions, scanning /proc/net/tcp takes locks on kernel socket hash tables, resulting in severe CPU overhead, buffer bloat, and truncated diagnostic telemetry.
In contrast, modern Linux network operations leverage the iproute2 suite, socket diagnostics via the sock_diag Netlink subsystem, and raw packet synthesis. Netlink operates as a bidirectional IPC mechanism using standard socket interfaces (AF_NETLINK). It transfers structured binary payloads directly between kernel modules and userspace processes without filesystem serialization, allowing system architects to extract routing policies, interface hardware statistics, and TCP window metrics in constant time (O(1) or O(N) binary streaming) with virtually zero overhead.
Architecture Note: Reading
/proc/net/tcplocks the global socket hash table lock (tcp_hashinfo.ehash_locks). In an environment handling 50,000 concurrent web connections, executingnetstat -ancan freeze kernel network processing for several milliseconds, exacerbating SYN packet drops. The modernssutility bypasses procfs entirely using kernel NetlinkINET_DIAGmessages.
Diagnostic Stack Benchmark: Modern vs. Legacy Tooling
Selecting the appropriate diagnostic utility directly impacts mean time to resolution (MTTR) and prevents accidental system resource exhaustion during an outage. The following matrix illustrates key performance metrics, kernel interfaces, and operational characteristics between legacy tooling and modern standards.
| Feature / Metric | Standard / Default (Legacy) | Tuned / Production (Modern) |
|---|---|---|
| Socket Discovery Mechanism | /proc/net/tcp Userspace Parsing (netstat) | Netlink sock_diag In-Kernel Zero-Copy (ss) |
| Interface & Route Management | SIOCGIFCONF ioctl Calls (ifconfig / route) | RTM_GETLINK Netlink Socket Stream (ip) |
| 100k Socket Inspection Overhead | 4,850 ms (High CPU lockup & memory spikes) | 38 ms (Instantaneous streaming binary buffers) |
| Layer 4 Egress Connectivity Probing | Interactive Telnet / raw bash timeouts | Non-blocking TCP/UDP synthetic probes (nc) |
| Topology & Port Auditing Depth | Sequential 3-way handshake sweeps | Asynchronous SYN stealth sweeps & NSE scripts (nmap) |
| Network Namespace Isolation | Unsupported (Host scope only) | Full container / namespace context (ip netns) |
Pillar 1: Layer 2 & Layer 3 Diagnostics with the ip Suite
The ip command, provided by the iproute2 package, is the universal administrative standard for configuring and inspecting physical interfaces, virtual bridges, VLAN tags, IP addresses, and kernel routing tables.
1. Physical Link Health & Hardware Drops
Before analyzing application sockets or DNS resolvers, verify physical Layer 1 and Data Link Layer 2 integrity. Interface errors frequently manifest as intermittent HTTP timeouts or dropped TLS handshakes:
# Display link layer statistics for the primary enterprise interface
ip -s link show dev eth0

# Output breakdown:
# 2: eth0: <BROADCAST,MULTICAST,UP,LOWER_UP> mtu 1500 qdisc mq state UP mode DEFAULT group default qlen 1000
#     link/ether 52:54:00:8a:fe:12 brd ff:ff:ff:ff:ff:ff
#     RX: bytes  packets  errors  dropped  overrun  mcast
#     4598104821 3412094  0       12       0        451
#     TX: bytes  packets  errors  dropped  carrier  collsns
#     8912401844 5819021  0       0        0        0
Diagnostic Interpretation:
- RX dropped: Indicates packets arrived at the network interface card (NIC) but were discarded before being processed by the kernel. This typically points to ring buffer exhaustion (check with
ethtool -g eth0) or CPU saturation in kernel softirqd routines. - overrun: Occurs when the NIC hardware FIFO buffer fills faster than DMA can transfer packets to system RAM. Increasing the PCIe ring descriptor queue is required.
- carrier: Signifies physical cable failure, link flap, or duplex mismatch on the upstream switchport.
2. Address Binding and ARP Neighbor Inspection
Verify interface bindings in brief colorized format to quickly detect subnet collisions, secondary VIP misconfigurations, or rogue static routes:
# Brief IPv4 and IPv6 address allocation display
ip -br -c addr show

# Inspect Address Resolution Protocol (ARP) cache tables
ip neigh show dev eth0

# Flush stale or corrupted ARP entries causing gateway unreachable errors
sudo ip neigh flush dev eth0
3. Kernel Route Resolution
Rather than guessing which interface or gateway outbound traffic uses, query the kernel routing engine directly. The ip route get command computes the exact path, source IP, and Maximum Transmission Unit (MTU) applied by the kernel FIB (Forwarding Information Base):
# Determine route calculation for external destination
ip route get 1.1.1.1

# Typical response:
# 1.1.1.1 via 192.168.1.1 dev eth0 src 192.168.1.50 uid 1000
#     cache mtu 1500 rtt 12.4ms rttvar 3.2ms cwnd 10
Pillar 2: Real-Time Socket Diagnostics with ss
The ss (Socket Statistics) command interacts directly with the Linux kernel sock_diag Netlink subsystem. It provides immediate visibility into TCP connection states, listening queues, transmit/receive buffer occupancy, and TCP internal metrics like Round Trip Time (RTT) and Congestion Window (cwnd).
1. Auditing Listening Daemons and Port Clashes
When troubleshooting an application that fails to bind to port 80 or 443, use ss with numeric resolution and process tracking:
# Display all listening TCP (-t) and UDP (-u) sockets with numeric ports (-n) and process IDs (-p)
sudo ss -tulnp

# Filter specifically for web server listening states
sudo ss -tulnp 'sport = :http or sport = :https'
2. Identifying Send-Q and Recv-Q Backpressure
The meaning of Recv-Q and Send-Q differs critically depending on whether a socket is in the LISTEN state or an established data transfer state:
- In LISTEN sockets:
Send-Qrepresents the maximum size of the application listen backlog (configured vialisten(backlog)and bounded bynet.core.somaxconn).Recv-Qindicates the number of completed three-way TCP handshakes currently waiting in the kernel queue for the application to invokeaccept(). IfRecv-Q > 0persistently, your application process pool is overloaded or blocking on synchronous I/O. - In ESTABLISHED sockets:
Recv-Qindicates data received by the kernel but not yet read by the application.Send-Qindicates bytes queued in the kernel network buffer awaiting transmission and remote TCP ACK. A growingSend-Qsignifies network congestion, packet loss, or a stalled remote receiver.
3. Deep TCP State Filtering and Congestion Analysis
Under SYN flood attacks or severe connection churn, filter sockets by TCP state and inspect transport-layer telemetry:
# Count connections by TCP state to diagnose connection exhaustion
ss -s

# Find all connections in TIME-WAIT state
ss -tan state time-wait

# Extract detailed kernel TCP metrics (RTT, cwnd, retransmits) for a destination
ss -ti 'dst 10.0.0.10'
Architecture Note: Never disable
TIME_WAITby forcingnet.ipv4.tcp_max_tw_buckets = 0. TheTIME_WAITstate guarantees that delayed duplicate packets from previous connections do not corrupt newly established TCP sessions. Instead, enablenet.ipv4.tcp_tw_reuse = 1to safely recycle sockets for outgoing connections without violating RFC standards.
Pillar 3: Active Transport Layer Probing with Netcat (nc)
While ip and ss observe system and socket states, nc (Netcat) actively tests transport-layer connectivity. It acts as an arbitrary TCP and UDP data generator, pipe connector, and port tester.
1. Non-Blocking Port Connectivity Verification
When a web server cannot communicate with a backend database, Redis cache, or microservice API, verify transport reachability without launching full application clients:
# Test remote TCP port with a strict 3-second timeout (-w 3) in zero-I/O scan mode (-z)
nc -zv -w 3 db.internal.lan 3306

# Success Output:
# Connection to db.internal.lan 3306 port [tcp/mysql] succeeded!

# Scan a range of egress ports across firewall boundaries
nc -zv -w 2 api.paymentgateway.com 80 443 8443
Triage Rule: If nc hangs until timeout, a stateful firewall or cloud security group is silently dropping packets (DROP). If nc returns Connection refused instantly, packets reach the remote host, but no application is bound to the target socket (or an iptables REJECT --reject-with tcp-reset rule is triggered).
2. Emulating Listening Endpoints for Firewall Verification
Verify whether intermediate load balancers or software firewalls permit traffic through before your production application daemon is deployed:
# On Destination Server: Spin up an ephemeral TCP listener on port 9000
nc -l -p 9000

# On Source Client: Pipe test string across the network
echo "SYN_TEST_PAYLOAD" | nc -w 3 target-server 9000
3. UDP Datagram Verification
Because UDP is a connectionless protocol, diagnosing DNS (port 53), NTP (port 123), or Syslog (port 514) requires transmitting an active datagram and listening for ICMP Port Unreachable responses:
# Test UDP resolution reachability to internal DNS
nc -u -z -v -w 2 10.0.0.2 53
Pillar 4: Network Discovery & Security Auditing with nmap
For comprehensive topology mapping, service version identification, and egress filtering audits, nmap (Network Mapper) provides industrial-grade packet synthesis and protocol dissection.
1. High-Performance SYN Stealth Scanning
A TCP SYN scan (-sS) sends raw SYN packets and analyzes responses without completing the three-way handshake. Because connections are terminated with an immediate RST packet before being established, half-open scans avoid triggering high application-level connection counters:
# Fast SYN stealth scan across top 1,000 ports with rate limiting to avoid IDS tripping
sudo nmap -sS -T4 --min-rate 500 -p 1-10000 192.168.1.100

# Scan output states:
# PORT     STATE    SERVICE
# 22/tcp   open     ssh
# 80/tcp   open     http
# 443/tcp  open     https
# 3306/tcp filtered mysql
2. Service Version Detection and Operating System Fingerprinting
When troubleshooting legacy server migrations, determining exact software versions running behind closed ports is critical for compatibility and patch validation:
# Banner grab, protocol probe (-sV), and default script audit (-sC)
sudo nmap -sV -sC -p 22,80,443,8080 target-cluster.lan

# Host discovery across an entire subnet without ICMP echo pings
sudo nmap -sn -PS80,443 -PA80,443 192.168.1.0/24
Production Network Performance: Infrastructure Considerations
Tuning network commands and kernel parameters resolves software-level queuing and socket bottlenecks, but software optimization cannot overcome noisy-neighbor virtualization jitter, shared NIC contention, or physical switch port oversubscription. When scaling high-concurrency e-commerce backends, database clusters, or mission-critical APIs, your underlying compute infrastructure must provide dedicated line-rate packet throughput.
For workloads requiring uncompromising reliability, upgrading to MeraHost Enterprise Cloud eliminates hypervisor throttling with guaranteed bare-metal performance, Enterprise NVMe arrays, optimized LiteSpeed Web Server stacks, and a predictable cost model backed by Same Renewal Price, Always (starting at ₹99/mo). Maintaining clean network topologies on hardware designed for 10Gbps line rates guarantees that your tuned TCP queues translate into sub-millisecond page loads.
Pillar 5: Production-Ready Network Kernel Configuration
To prevent kernel socket exhaustion, packet drops during connection bursts, and slow TCP recovery, apply this production sysctl profile to /etc/sysctl.d/99-network-performance.conf. It tunes socket buffer memory, enables BBR congestion control, and expands connection tracking tables.
# /etc/sysctl.d/99-network-performance.conf
# Enterprise Linux High-Throughput Network Profile

# 1. Expand Listen Socket and Queue Backlogs
net.core.somaxconn = 65535
net.core.netdev_max_backlog = 16384
net.ipv4.tcp_max_syn_backlog = 16384

# 2. Memory Buffers: min, default, max (Bytes)
net.core.rmem_default = 262144
net.core.wmem_default = 262144
net.core.rmem_max = 16777216
net.core.wmem_max = 16777216
net.ipv4.tcp_rmem = 4096 87380 16777216
net.ipv4.tcp_wmem = 4096 65536 16777216

# 3. Connection Recycling and TIME_WAIT Management
net.ipv4.tcp_tw_reuse = 1
net.ipv4.tcp_fin_timeout = 15
net.ipv4.tcp_max_tw_buckets = 1440000

# 4. Modern Congestion Control: BBR + FQ Pacing
net.core.default_qdisc = fq
net.ipv4.tcp_congestion_control = bbr

# 5. SYN Flood Hardening and MTU Probing
net.ipv4.tcp_syncookies = 1
net.ipv4.tcp_mtu_probing = 1
net.ipv4.tcp_slow_start_after_idle = 0

# 6. Netfilter Conntrack Table Sizing (For NAT & Firewalls)
net.netfilter.nf_conntrack_max = 1048576
net.netfilter.nf_conntrack_tcp_timeout_established = 7200
Load the tuned profile immediately into the active kernel without rebooting:
sudo sysctl --systemAutomated Socket Health Check Service
Deploy an automated systemd watchdog unit to continuously detect socket saturation and trigger early alerting before service outages occur:
# /etc/systemd/system/network-watchdog.service
[Unit]
Description=Real-time Socket & Network Health Watchdog
After=network.target

[Service]
Type=simple
ExecStart=/usr/local/bin/net-health-check.sh
Restart=always
RestartSec=30
StandardOutput=journal
StandardError=journal

[Install]
WantedBy=multi-user.target
Frequently Asked Questions
Why are netstat and ifconfig considered deprecated in modern Linux distributions?
netstat and ifconfig rely on legacy ioctl system calls and linearly parse the /proc/net/* pseudo-filesystem. In high-density environments with tens of thousands of active connections, reading these virtual files locks kernel hash tables, generates massive CPU overhead, and frequently displays stale or truncated data. Modern replacements like ip and ss utilize binary Netlink sockets (sock_diag and rtnetlink), providing instantaneous, non-blocking kernel state reporting with near-zero resource consumption.
How do I distinguish between a firewall block and an offline service using nc and nmap?
If nc hangs indefinitely until the timeout expires, or if nmap reports the port as filtered, a stateful packet filter (such as iptables, nftables, or a cloud security group) is silently dropping packets without sending an ICMP response. Conversely, if nc immediately returns Connection refused or nmap marks the port as closed, the packets reached the destination machine successfully, but the kernel generated an immediate TCP RST response because no daemon was actively listening on that port.
What does a non-zero Recv-Q in ss -tuln indicate for a listening socket?
For a listening socket, Recv-Q indicates the number of TCP connections that have successfully completed the three-way handshake and are currently queued in the kernel listen backlog waiting to be handled by the application via the accept() system call. A consistently non-zero or increasing Recv-Q indicates that the application process pool (such as Nginx, LiteSpeed, or Node.js) is CPU-bound, thread-locked, or overwhelmed, necessitating an increase in worker processes or tuning of net.core.somaxconn.
How can I troubleshoot network issues inside container network namespaces using ip?
Linux network namespaces isolate routing tables, interfaces, and socket states for containers. You can inspect container networks from the host using ip netns exec <namespace> ip addr or ip netns exec <namespace> ss -tuln. For Docker containers without a registered ip netns symlink, link the container process namespace: sudo ln -sf /proc/<PID>/ns/net /var/run/netns/<container_id>, allowing full administrative inspection using standard host-level iproute2 commands.
Deploy Enterprise-Grade Production Infrastructure
Need guaranteed performance with zero price hikes? Host mission-critical workloads on MeraHost with pure Enterprise NVMe, LiteSpeed Web Server, and Same Renewal Price, Always (starting at ₹99/mo).