
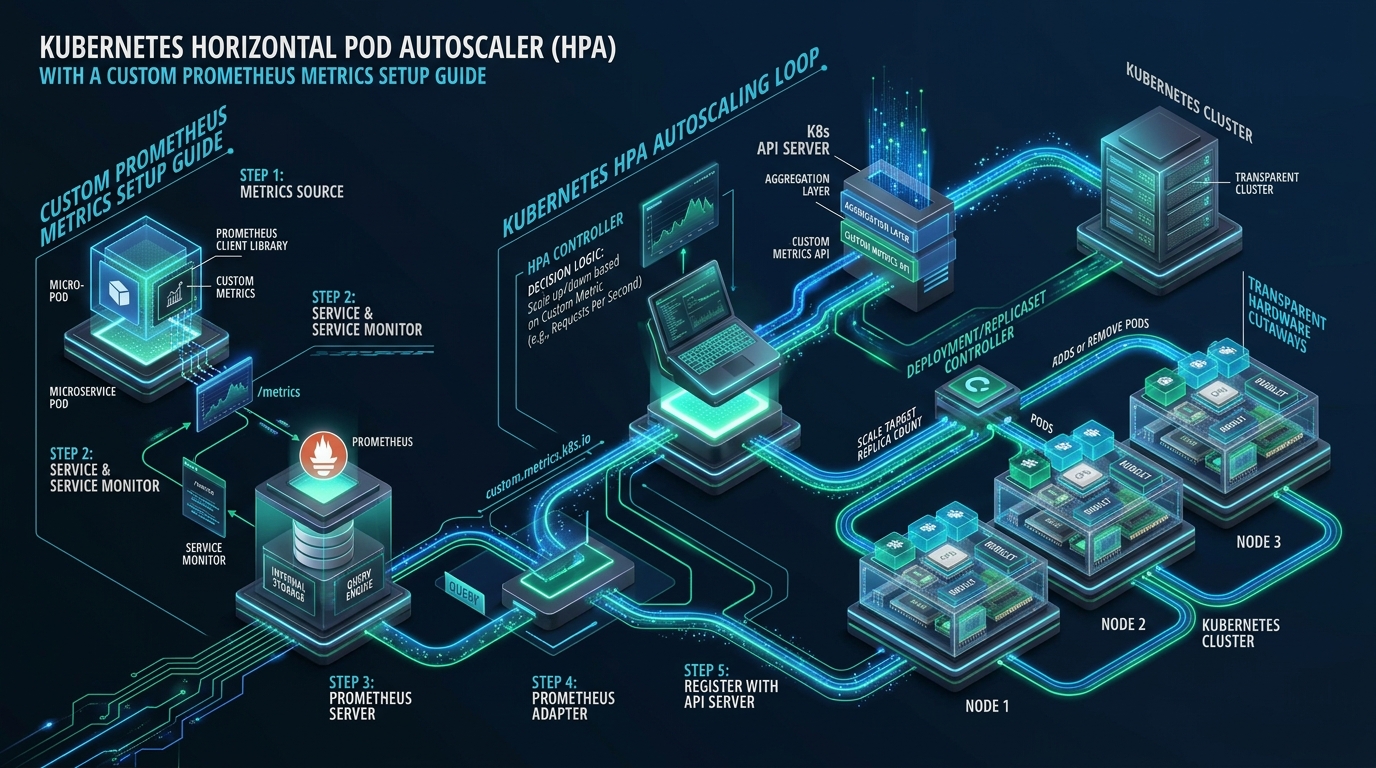
Relying exclusively on standard CPU and memory utilization thresholds for Kubernetes autoscaling leaves production microservices vulnerable to catastrophic queuing delays, latency spikes, and traffic saturation during I/O-intensive spikes. When an unexpected influx of HTTP traffic or asynchronous queue workers hits an application, memory consumption often remains static while internal event loops block, request queues swell, and response latencies explode past acceptable SLA limits. By architecting an event-driven scaling pipeline using custom Prometheus application metrics—such as HTTP request rates, active socket connections, and message queue depths—systems engineers can proactively scale workloads before system resources choke. In this guide, our engineering team at CpanelFree breaks down the end-to-end implementation of the Kubernetes Horizontal Pod Autoscaler (HPA v2) powered by Prometheus Adapter and custom metrics APIs.
How to Configure Kubernetes HPA with Custom Prometheus Metrics
Direct Answer: To autoscale Kubernetes workloads on custom Prometheus metrics, expose application telemetry via /metrics, ingest data into Prometheus, deploy the prometheus-adapter registered to custom.metrics.k8s.io via the Kubernetes API Aggregation Layer, map Prometheus PromQL expressions to Kubernetes metric rules, and apply an autoscaling/v2 HPA resource targeting your specific custom metric threshold.
The Limitations of Native Resource Autoscaling in High-Throughput Microservices
Modern cloud-native applications rarely fail because of a sudden, uniform exhaustion of CPU or RAM. In event-driven Node.js runtimes, Go microservices, and asynchronous Python worker pools, network I/O wait times and thread contention frequently cause API degradation long before CPU limits are triggered. For example, a single Go microservice thread pool handling thousands of concurrent HTTP connections might maintain a modest 25% CPU utilization while inbound requests are queued indefinitely due to upstream database connection pool exhaustion or socket starvation. Under default Kubernetes autoscaling policies, the cluster’s metrics-server polls the container cgroup statistics via the kubelet Summary API, sees healthy CPU levels, and makes no adjustments to pod replica counts.
Conversely, memory-based autoscaling presents severe pitfalls in garbage-collected programming languages. Java Virtual Machines (JVM), Go runtime allocations, and V8 engines retain memory allocations within their heap space long after transaction payloads have finished processing. When an HPA configuration evaluates memory usage, it interprets this reserved heap space as sustained workload pressure. This creates dangerous flapping behaviors where the cluster needlessly provisions additional pods, or worse, fails to scale down due to lazy memory reclamation by the runtime garbage collector.
To eliminate these blind spots, infrastructure engineers must transition from resource-based scaling (CPU and Memory) to rate-based and queue-based scaling. By leveraging the Kubernetes API Aggregation Layer with custom metrics providers such as the Prometheus Adapter, the cluster control plane can continuously query domain-specific telemetry—including HTTP request rates (RPS), P95/P99 latency measurements, gRPC message queues, and active worker job counts.
The Kubernetes Metrics Pipeline Architecture
Understanding how metrics travel from application code to the Horizontal Pod Autoscaler is critical for debugging deployment issues. In Kubernetes, the autoscaling ecosystem is split into three distinct API pipelines:
- Core Resource Metrics (
metrics.k8s.io): Served directly by the lightweightmetrics-server. It scrapes CPU and memory usage from cgroup controllers on worker nodes via the kubelet Summary API. It is completely stateless, non-configurable, and exposes only raw compute metrics. - Custom Metrics API (
custom.metrics.k8s.io): Served by an aggregated API server (such asprometheus-adapter). It allows the Kubernetes controller manager to query application-specific metrics that are explicitly bound to Kubernetes objects, such as Pods, Services, or Namespaces. - External Metrics API (
external.metrics.k8s.io): Also served by custom adapters, this API handles telemetry that originates outside the cluster boundaries or is not bound to a specific Kubernetes resource object—such as AWS SQS queue lengths, Kafka consumer lag, or Cloudflare edge traffic.
Architecture Note: The Kubernetes API server relies on the API Aggregation Layer (kube-aggregator) to dynamically route requests for
custom.metrics.k8s.ioto the Prometheus Adapter service running inside your cluster. This requires valid front-proxy mutual TLS certificates and seamless cluster DNS resolution.
Mathematical Mechanics of the HPA Control Loop
The Horizontal Pod Autoscaler operates on an active feedback control loop executed periodically by the kube-controller-manager (governed by the --horizontal-pod-autoscaler-sync-period flag, which defaults to 15 seconds). During each evaluation tick, the controller computes the target replica count using the canonical mathematical formula:
desiredReplicas = ceil[ currentReplicas × ( currentMetricValue / targetMetricValue ) ]
Consider a production payment processing microservice currently running across 4 replicas. You have configured an HPA rule targeting an average throughput of 50 requests per second (RPS) per pod (AverageValue: 50). During a flash-sale event, Prometheus aggregates a total cluster-wide rate of 320 requests per second across the active pods. The HPA calculates:
- Current Metric Value per Pod:
320 RPS / 4 Pods = 80 RPS - Scaling Ratio:
80 / 50 = 1.6 - Desired Pod Count:
ceil[ 4 × 1.6 ] = ceil[ 6.4 ] = 7 Pods
Notice that Kubernetes automatically uses ceiling math (ceil) to guarantee that incoming traffic headroom is never truncated down. Furthermore, the controller manager includes a built-in tolerance gate governed by the --horizontal-pod-autoscaler-tolerance flag (defaulting to 0.1, or 10%). If the ratio between current and target metric values falls within the range of 0.90 to 1.10, the controller suppresses scaling actions. This damping mechanism prevents rapid micro-adjustments and pod thrashing caused by small transient traffic spikes.
Comparative Architectural Matrix: Default Resource Metrics vs. Custom Prometheus Metrics
The following matrix highlights the critical technical divergences between default Kubernetes CPU/RAM scaling and custom Prometheus metric-driven autoscaling:
| Feature / Metric | Standard / Default | Tuned / Production |
|---|---|---|
| Metric Telemetry Source | kubelet cgroups via metrics-server (CPU/RAM only) | Prometheus Adapter & custom.metrics.k8s.io (RPS, Latency, Queue) |
| Scaling Signal Latency (TTR) | 60–180 seconds (lagging indicator after load builds) | 10–25 seconds (leading indicator based on instant request rates) |
| Traffic Burst Resilience | Poor (fails during I/O waits without CPU spikes) | Excellent (scales directly on active connections and ingress rates) |
| Stabilization Window Control | Fixed global kube-controller-manager defaults | Fine-grained per-workload scaling policies (HPA v2 behavior block) |
| Infrastructure Cost Efficiency | Over-provisioning needed to absorb spikes | Optimal (dynamically sizes pods to exact throughput requirements) |
| Query Flexibility | None (hardcoded CPU millicores and RAM bytes) | Full PromQL expressions (rates, histograms, percentiles, sums) |
Step 1: Instrumenting the Microservice and Exposing Prometheus Metrics
For Prometheus to scrape application throughput, microservices must expose standard OpenMetrics or Prometheus-formatted metrics via an internal HTTP endpoint (typically /metrics). The primary metric used for request-rate autoscaling is a monotonically increasing counter tracking completed HTTP transactions, such as http_requests_total labeled with HTTP status codes and route paths.
Below is a production-grade Kubernetes Deployment and Service manifest configured with Prometheus Operator ServiceMonitor annotations to guarantee continuous scraping:
apiVersion: apps/v1
kind: Deployment
metadata:
  name: api-gateway
  namespace: production
  labels:
    app.kubernetes.io/name: api-gateway
spec:
  replicas: 3
  selector:
    matchLabels:
      app.kubernetes.io/name: api-gateway
  template:
    metadata:
      labels:
        app.kubernetes.io/name: api-gateway
      annotations:
        prometheus.io/scrape: "true"
        prometheus.io/port: "8080"
        prometheus.io/path: "/metrics"
    spec:
      containers:
      - name: gateway
        image: registry.example.com/production/api-gateway:v2.4.1
        ports:
        - name: http
          containerPort: 8080
        resources:
          requests:
            cpu: "250m"
            memory: "256Mi"
          limits:
            cpu: "1000m"
            memory: "512Mi"
        readinessProbe:
          httpGet:
            path: /healthz
            port: 8080
          initialDelaySeconds: 5
          periodSeconds: 10
---
apiVersion: v1
kind: Service
metadata:
  name: api-gateway
  namespace: production
  labels:
    app.kubernetes.io/name: api-gateway
spec:
  ports:
  - name: http
    port: 8080
    targetPort: 8080
  selector:
    app.kubernetes.io/name: api-gateway
---
apiVersion: monitoring.coreos.com/v1
kind: ServiceMonitor
metadata:
  name: api-gateway-monitor
  namespace: production
  labels:
    release: prometheus
spec:
  selector:
    matchLabels:
      app.kubernetes.io/name: api-gateway
  endpoints:
  - port: http
    interval: 15s
    path: /metrics
Step 2: Deploying and Configuring the Prometheus Adapter
The prometheus-adapter acts as a translation layer. It continuously polls Prometheus, executes configured PromQL queries, and translates the raw scalar timeseries into the standardized Kubernetes API format under custom.metrics.k8s.io/v1beta1.
When installing the adapter via Helm, the configuration file specifies four critical directives: discovery (seriesQuery), Kubernetes association (resources), naming convention (name), and the metric aggregation formula (metricsQuery). Below is the hardened production configuration file (prometheus-adapter-values.yaml):
# prometheus-adapter-values.yaml
prometheus:
  url: http://prometheus-k8s.monitoring.svc.cluster.local
  port: 9090
  path: ""

rules:
  default: false
  custom:
  - seriesQuery: 'http_requests_total{kubernetes_namespace!="",kubernetes_pod_name!=""}'
    resources:
      overrides:
        kubernetes_namespace: {resource: "namespace"}
        kubernetes_pod_name: {resource: "pod"}
    name:
      matches: "^http_requests_total"
      as: "http_requests_per_second"
    metricsQuery: 'sum(rate(<<.Series>>{<<.LabelMatchers>>}[2m])) by (<<.GroupBy>>)'

  - seriesQuery: 'http_request_duration_seconds_bucket{kubernetes_namespace!="",kubernetes_pod_name!=""}'
    resources:
      overrides:
        kubernetes_namespace: {resource: "namespace"}
        kubernetes_pod_name: {resource: "pod"}
    name:
      matches: "^http_request_duration_seconds_bucket"
      as: "http_p95_latency_seconds"
    metricsQuery: 'histogram_quantile(0.95, sum(rate(<<.Series>>{<<.LabelMatchers>>}[2m])) by (le, <<.GroupBy>>))'

logLevel: 2
resources:
  requests:
    cpu: 100m
    memory: 128Mi
  limits:
    cpu: 500m
    memory: 512Mi
Architecture Note: Always specify a rate duration window (e.g.
[2m]) in yourmetricsQuerythat is at least 4 times larger than your Prometheus scrape interval (15 seconds). Using small windows like[30s]leads to zero-rate glitches or metric drops if a single scrape round is delayed or dropped, triggering false scale-down actions.
Step 3: Validating the Aggregated Custom Metrics API
Once deployed, verify that the Kubernetes API server has registered the new extension API service and can successfully relay requests to the Prometheus Adapter. Run the following diagnostic commands:
# Verify the APIService registration status
kubectl get apiservice v1beta1.custom.metrics.k8s.io

# Expected Output:
# NAME                            SERVICE                               AVAILABLE   AGE
# v1beta1.custom.metrics.k8s.io   monitoring/prometheus-adapter   True        5m

# Query the raw aggregated custom metrics endpoint for pods in the production namespace
kubectl get --raw "/apis/custom.metrics.k8s.io/v1beta1/namespaces/production/pods/*/http_requests_per_second" | jq .
A healthy response returns an API list where each active pod in the namespace reports its current calculated rate in millimetric format (e.g., 52340m represents 52.34 requests per second). If the output returns an empty items array or a 503 error, verify that Prometheus is actively collecting data and that the pod labels match the kubernetes_namespace and kubernetes_pod_name overrides configured in your adapter rules.
Step 4: Defining the Production HPA v2 with Fine-Grained Scaling Behavior
With custom metrics successfully registered in the API aggregation layer, configure the Horizontal Pod Autoscaler using the modern autoscaling/v2 API specification. In production environments, simple metric targeting is insufficient; you must define explicit behavior stabilization policies to handle traffic bursts without inducing thrashing.
apiVersion: autoscaling/v2
kind: HorizontalPodAutoscaler
metadata:
  name: api-gateway-hpa
  namespace: production
spec:
  scaleTargetRef:
    apiVersion: apps/v1
    kind: Deployment
    name: api-gateway
  minReplicas: 3
  maxReplicas: 30
  metrics:
  - type: Pods
    pods:
      metric:
        name: http_requests_per_second
      target:
        type: AverageValue
        averageValue: "100"
  - type: Resource
    resource:
      name: cpu
      target:
        type: Utilization
        averageUtilization: 75
  behavior:
    scaleUp:
      stabilizationWindowSeconds: 0
      select: Max
      policies:
      - type: Percent
        value: 100
        periodSeconds: 15
      - type: Pods
        value: 4
        periodSeconds: 15
    scaleDown:
      stabilizationWindowSeconds: 300
      select: Min
      policies:
      - type: Percent
        value: 10
        periodSeconds: 60
In this production manifest:
- Dual Metric Evaluation: The HPA evaluates both the custom metric (
http_requests_per_second) and compute capacity (CPU utilization). Kubernetes computes replica recommendations for each metric independently and scales to the highest calculated replica count to prevent under-provisioning. - Instant Scale-Up: The
scaleUp.stabilizationWindowSeconds: 0ensures that incoming traffic surges are matched instantly without delay. The policy allows scaling up by either 100% or 4 pods every 15 seconds, whichever is greater (select: Max). - Hysteresis Dampening (Scale-Down): The
scaleDown.stabilizationWindowSeconds: 300introduces a 5-minute cooling window. If traffic drops momentarily, the controller waits 300 seconds before pruning pods, and restricts reductions to at most 10% of total replicas per minute (select: Min). This completely eliminates cluster flapping.
Step 5: Worker Node Kernel Tuning for Rapid Elastic Scaling
When an HPA rapidly scales pods from 3 to 30 instances during a sudden traffic spike, worker nodes face intense network socket churning, connection tracking table saturation, and ephemeral port exhaustion. If the underlying Linux kernel is left on standard vendor defaults, incoming SYN packets will be dropped at the host layer before they ever reach the container network interface (CNI).
Apply the following hardened kernel configuration to /etc/sysctl.d/99-kubernetes-ingress-hpa.conf on all Kubernetes worker nodes:
# /etc/sysctl.d/99-kubernetes-ingress-hpa.conf
# High-concurrency socket queue and backlog tuning
net.core.somaxconn = 65535
net.ipv4.tcp_max_syn_backlog = 65535
net.core.netdev_max_backlog = 65535

# Expand ephemeral port range to prevent local port exhaustion
net.ipv4.ip_local_port_range = 1024 65535

# TCP connection lifecycle and recycling
net.ipv4.tcp_tw_reuse = 1
net.ipv4.tcp_fin_timeout = 15
net.ipv4.tcp_keepalive_time = 300
net.ipv4.tcp_keepalive_intvl = 15
net.ipv4.tcp_keepalive_probes = 5

# Netfilter connection tracking limits for high container density
net.netfilter.nf_conntrack_max = 1048576
net.netfilter.nf_conntrack_tcp_timeout_established = 600

# File descriptor limits
fs.file-max = 2097152
Activate the configuration immediately without rebooting:
sudo sysctl -p /etc/sysctl.d/99-kubernetes-ingress-hpa.confArchitectural Reliability and Hardware Foundation
Autoscaling elasticity in Kubernetes is only as reliable as the underlying physical or virtualized infrastructure. When pods are rapidly initialized across nodes, container runtimes pull images, mount ephemeral storage volumes, and bind network endpoints. If your Kubernetes worker nodes reside on hypervisors plagued by noisy neighbors, throttled cloud EBS storage, or unpredictable CPU stealing, container initialization times surge from 3 seconds to over 60 seconds.
Under heavy traffic spikes, this startup latency renders horizontal autoscaling ineffective, causing request backlogs to overwhelm existing pods before replacement instances become healthy. For mission-critical workloads that require guaranteed deterministic I/O performance and lightning-fast container startup, deploying your Kubernetes control plane and high-density node pools on MeraHost Enterprise Cloud provides dedicated enterprise NVMe storage arrays, isolated high-throughput networking, and transparent pricing without unexpected renewal inflation.
Production Troubleshooting and Native Accordion FAQs
Below are real-world operational challenges encountered when maintaining custom Prometheus metrics in high-scale Kubernetes clusters:
Why does ‘kubectl get hpa’ show ‘<unknown>/100’ under the TARGETS column?
This issue occurs when the HPA controller cannot retrieve metrics from the custom metrics API. First, inspect the HPA events using kubectl describe hpa <name> to identify the exact error message. Common root causes include: (1) The Prometheus Adapter is failing to connect to the Prometheus service URL, (2) The PromQL series query does not find matching labels for kubernetes_pod_name or kubernetes_namespace, (3) The pod readiness probe is failing, causing the pod to be excluded from service endpoints, or (4) The metric name declared in the HPA does not match the as: alias configured in the adapter rules.
What is the operational difference between ‘Pods’, ‘Object’, and ‘External’ metric types in HPA v2?
The Pods metric type represents a metric collected from individual container pods and averaged across all running pods in the target deployment (using target.type: AverageValue). The Object metric type describes a metric that belongs to a specific Kubernetes entity other than the target pods (for example, the number of ingress connections on an Ingress object, or total transaction depth on a Service). The External metric type references metrics completely outside Kubernetes objects (such as AWS SQS queue length or RabbitMQ cluster depth) using target.type: Value or AverageValue.
How do I authenticate Prometheus Adapter when Prometheus requires mTLS or Bearer Tokens?
In production environments where Prometheus is protected by mutual TLS (mTLS) or OAuth proxy tokens, you must mount secrets into the Prometheus Adapter deployment. In the Helm values.yaml, configure prometheus.auth.type: bearer and reference the secret containing the service account token, or set prometheus.tls.enable: true with caCert, clientCert, and clientKey paths mounted from a Kubernetes Secret. This allows the adapter to securely query the Prometheus API across protected network boundaries.
How can we prevent Prometheus Adapter cache lag from delaying autoscaling decisions?
By default, Prometheus Adapter caches discovered metrics and series queries. If series discovery takes too long, configure metricsRelistInterval to 1m or 30s instead of the default 10m in the adapter arguments. Additionally, ensure your PromQL queries in the adapter rules avoid expensive regex aggregations across millions of timeseries. Target specific metric names and namespace labels directly to keep query response latencies under 200ms.
Deploy Enterprise-Grade Production Infrastructure
Need guaranteed performance with zero price hikes? Host mission-critical workloads on MeraHost with pure Enterprise NVMe, LiteSpeed Web Server, and Same Renewal Price, Always (starting at ₹99/mo).