
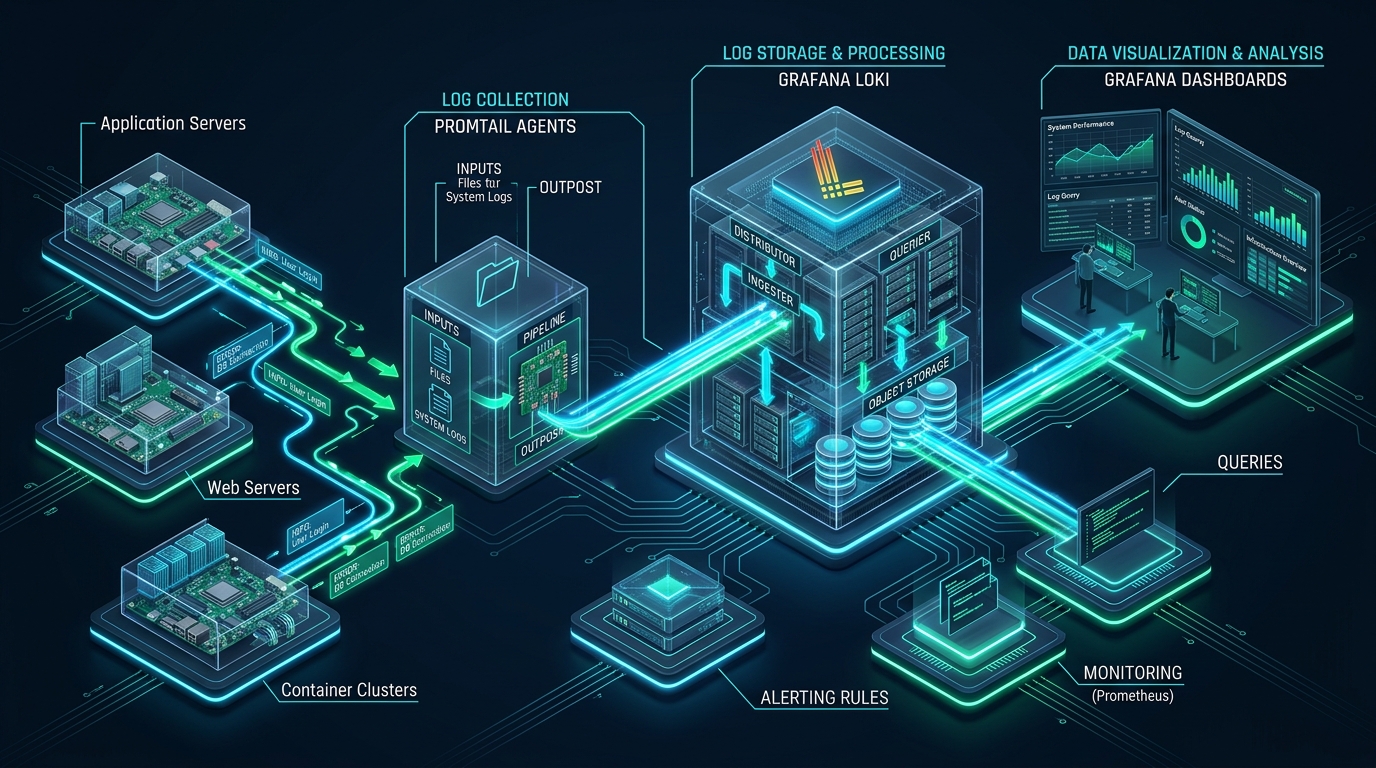
Modern distributed infrastructure and microservice fleets generate massive streams of telemetry that quickly overwhelm traditional full-text log indexing platforms, exhausting JVM heap allocations and driving enterprise storage budgets out of control. While indexing every raw character string was once standard practice, it creates severe disk I/O bottlenecks, costly Lucene index segment merges, and crippling garbage collection pauses during live incident triage. By decoupling metadata indexing from compressed block storage, Linux systems engineers can achieve sub-second query performance and up to 80% lower operational overhead across staging and testing environments on CpanelFree without sacrificing granular auditability.
Core Architecture: The Promtail, Loki, and Grafana (PLG) Paradigm
The Promtail, Loki, and Grafana (PLG) stack is intentionally engineered to mirror Prometheus’ multi-dimensional label model. Rather than tokenizing, parsing, and maintaining a global inverted index of every word inside each log line, Loki groups related log lines into unique data streams defined entirely by label sets (such as job="syslog", environment="production", or host="node-01").
This architectural distinction establishes a clear division of operational responsibilities across three discrete pipeline stages:
- Promtail (Log Shipper & Edge Processor): An efficient Go agent deployed across host nodes and container runtimes. Promtail monitors target log files, tailing systemd journal entries or application files, executes pipeline transformations (timestamp extraction, multiline regex parsing, drop rules), attaches standardized labels, and dispatches compressed batches to Loki over HTTP/gRPC.
- Loki (Ingestion, Chunking & Storage Engine): The core log aggregation daemon. Loki receives batched entries from Promtail, buffers them in memory via the Ingester, flushes compressed immutable chunks (using Snappy or Gzip) to durable persistent storage, and maintains a lightweight TSDB or BoltDB metadata index.
- Grafana (Visualization & Exploration Layer): The analytics frontend where site reliability engineers query log streams using LogQL. Grafana enables seamless cross-correlation between time-series Prometheus system metrics and contextual log entries on a unified timeline.
Architecture Note: Because Loki does not build full-text indexes during write operations, ingestion throughput is practically bounded only by network bandwidth and sequential disk write speeds. Compute cost is dynamically shifted from ingestion time to query time, where distributed queriers parallelize LogQL stream filtering across horizontally distributed chunks.
Architectural Benchmark: Loki vs. Traditional Elasticsearch (ELK)
Engineering leadership evaluating centralized log infrastructure must weigh storage compression ratios, operational overhead, and memory footprints. The comparative matrix below outlines key operational differences between a tuned Loki deployment and traditional Elasticsearch/Logstash architectures under high-volume Linux server workloads.
| Feature / Metric | Standard / Default (ELK Stack) | Tuned / Production (Grafana Loki) |
|---|---|---|
| Indexing Model | Full-text inverted Lucene index | Stream labels & chunk metadata only |
| Memory Consumption (RAM) | High (16GB – 32GB JVM heap required) | Low (512MB – 4GB Go memory footprint) |
| Compression Efficiency | 2:1 to 3:1 average on text tokens | 5:1 to 10:1 (Snappy / Gzip block compression) |
| Storage Backend | Expensive local SSD/NVMe RAID volumes | Local NVMe or cheap S3-compatible Object Storage |
| Ingestion CPU Overhead | Heavy (tokenization, stemming, schema parsing) | Minimal (sequential stream chunking) |
| Query Language | Kibana KQL & Elasticsearch JSON DSL | LogQL (PromQL-compatible syntax & metrics) |
| Maintenance & Upkeep | Shard rebalancing, segment merges, JVM GC tuning | Single monolithic binary or stateless containers |
Host Kernel Optimization for High-Throughput Ingestion
Before launching Loki and Promtail in production, the underlying Linux kernel must be tuned to prevent socket exhaustion, dropped file descriptors, and inotify watch exhaustion when tailing multiple high-velocity application logs. Create a dedicated sysctl configuration profile under /etc/sysctl.d/99-loki-promtail.conf:
# /etc/sysctl.d/99-loki-promtail.conf
# Linux Kernel Network & Filesystem Optimization for Loki/Promtail

# Expand inotify capacity for Promtail file system watchers
fs.inotify.max_user_watches = 1048576
fs.inotify.max_user_instances = 8192

# Expand system-wide file descriptor allocations
fs.file-max = 2097152

# Socket backlog and connection tuning for high ingestion concurrency
net.core.somaxconn = 65535
net.ipv4.tcp_max_syn_backlog = 16384
net.core.netdev_max_backlog = 16384

# TCP window size and memory buffers (16MB max)
net.core.rmem_max = 16777216
net.core.wmem_max = 16777216
net.ipv4.tcp_rmem = 4096 87380 16777216
net.ipv4.tcp_wmem = 4096 65536 16777216

# Accelerate socket recycling to eliminate TIME_WAIT exhaustion
net.ipv4.tcp_tw_reuse = 1
net.ipv4.tcp_fin_timeout = 15

# Memory management: Prevent aggressive swapping during query spikes
vm.swappiness = 10
vm.max_map_count = 524288
Apply the parameters immediately without rebooting the host:
sudo sysctl -p /etc/sysctl.d/99-loki-promtail.confProduction Grafana Loki Configuration (/etc/loki/config.yml)
The following configuration file is hardened for production single-binary or monolithic deployments. It leverages the modern TSDB index shipper format, activates the write-ahead log (WAL) for crash durability, and establishes strict ingestion rate limits to protect CPU resources.
# /etc/loki/config.yml
# Production Configuration for Grafana Loki (Monolithic / Single-Binary Mode)
auth_enabled: false

server:
  http_listen_address: 0.0.0.0
  http_listen_port: 3100
  grpc_listen_port: 9096
  log_level: info
  grpc_server_max_recv_msg_size: 16777216
  grpc_server_max_send_msg_size: 16777216

common:
  path_prefix: /var/lib/loki
  storage:
    filesystem:
      chunks_directory: /var/lib/loki/chunks
      rules_directory: /var/lib/loki/rules
  replication_factor: 1
  ring:
    instance_addr: 127.0.0.1
    kvstore:
      store: inmemory

ingester:
  lifecycler:
    address: 127.0.0.1
    ring:
      kvstore:
        store: inmemory
      replication_factor: 1
    final_sleep: 0s
  chunk_idle_period: 15m
  max_chunk_age: 1h
  chunk_target_size: 1572864  # 1.5 MB chunk target for optimal compression
  chunk_retain_period: 30s
  wal:
    enabled: true
    dir: /var/lib/loki/wal
    flush_on_shutdown: true

schema_config:
  configs:
    - from: 2024-01-01
      store: tsdb
      object_store: filesystem
      schema: v13
      index:
        prefix: index_
        period: 24h

storage_config:
  tsdb:
    working_directory: /var/lib/loki/tsdb-index
  filesystem:
    directory: /var/lib/loki/chunks

limits_config:
  enforce_metric_name: false
  reject_old_samples: true
  reject_old_samples_max_age: 168h       # Reject logs older than 7 days
  ingestion_rate_mb: 32                  # 32 MB/s burst ingestion cap
  ingestion_burst_size_mb: 64
  max_line_size: 256000                  # 256 KB max single log line size
  max_entries_limit_per_query: 10000
  max_query_length: 721h                 # 30 days maximum query span
  retention_period: 720h                 # 30 days retention policy

compactor:
  working_directory: /var/lib/loki/compactor
  compaction_interval: 10m
  retention_enabled: true
  retention_delete_delay: 2h
  retention_delete_worker_count: 150

query_range:
  results_cache:
    cache:
      embedded_cache:
        enabled: true
        max_size_mb: 500
        ttl: 24h

table_manager:
  retention_deletes_enabled: false
  retention_period: 0s
Architecture Note on Cardinality: The single most common pitfall in Loki implementations is label explosion. Never assign dynamic attributes—such as client IP addresses, session IDs, request UUIDs, or user IDs—as stream labels. Every unique label combination creates an independent data stream in memory. High cardinality strains ingester memory and explodes TSDB index sizes. Keep labels coarse-grained (e.g.,
app,env,host) and extract high-cardinality values dynamically during query execution using LogQL line filters and regex parsers.
Production Promtail Scrape and Pipeline Configuration (/etc/promtail/config.yml)
Promtail operates as the localized ingestion agent. The configuration below scrapes system syslog, systemd journal logs, and Nginx web server access logs, utilizing sophisticated pipeline stages for multiline stack trace collation and noise reduction:
# /etc/promtail/config.yml
# Production Promtail Configuration with Multiline and Filtering Pipelines
server:
  http_listen_port: 9080
  grpc_listen_port: 0
  log_level: info

positions:
  filename: /var/lib/promtail/positions.yaml

clients:
  - url: http://127.0.0.1:3100/loki/api/v1/push
    batchwait: 1s
    batchsize: 1048576  # 1 MB push batches
    timeout: 10s
    backoff_config:
      min_period: 500ms
      max_period: 5s
      max_retries: 5

scrape_configs:
  # 1. System Syslog and Authentication Logs
  - job_name: system
    static_configs:
      - targets:
          - localhost
        labels:
          job: varlog
          host: node-prod-01
          __path__: /var/log/{syslog,messages,auth.log,secure}

  # 2. Native systemd-journald Ingestion
  - job_name: journal
    journal:
      max_age: 12h
      labels:
        job: systemd-journal
        host: node-prod-01
    relabel_configs:
      - source_labels: ['__journal__systemd_unit']
        target_label: 'unit'
      - source_labels: ['__journal__hostname']
        target_label: 'hostname'
      - source_labels: ['__journal_priority_keyword']
        target_label: 'level'

  # 3. High-Traffic Nginx Web Logs with Filter Pipeline
  - job_name: nginx
    static_configs:
      - targets:
          - localhost
        labels:
          job: nginx
          service: reverse-proxy
          __path__: /var/log/nginx/*access.log
    pipeline_stages:
      # Drop routine health check probes to save storage and CPU bandwidth
      - regex:
          expression: '"(GET|HEAD) (/(healthz|health|metrics|ping)) HTTP'
      - match:
          selector: '{job="nginx"}'
          action: drop
          drop_counter_reason: routine_health_check

  # 4. Application Stack Trace Parsing (Java / Python / PHP)
  - job_name: application
    static_configs:
      - targets:
          - localhost
        labels:
          job: app
          app_name: core-api
          __path__: /var/log/apps/api/*.log
    pipeline_stages:
      # Collate multiline stack traces starting with non-timestamp lines
      - multiline:
          firstline: '^\d{4}-\d{2}-\d{2}[ T]\d{2}:\d{2}:\d{2}'
          max_wait_time: 3s
          max_lines: 500
      # Parse JSON log payloads dynamically
      - json:
          expressions:
            log_level: level
            request_id: trace_id
            msg: message
      - labels:
          level: log_level
Systemd Process Hardening & Service Supervision
Running logging infrastructure under root privileges exposes the host to security escalation vulnerabilities. The following production systemd service definitions enforce privilege separation, sandboxing, and resource ceiling limits.
Create the Loki systemd unit file at /etc/systemd/system/loki.service:
# /etc/systemd/system/loki.service
[Unit]
Description=Grafana Loki Log Aggregation Service
Documentation=https://grafana.com/docs/loki/latest/
After=network-online.target
Wants=network-online.target

[Service]
Type=simple
User=loki
Group=loki
ExecStart=/usr/local/bin/loki -config.file=/etc/loki/config.yml
Restart=always
RestartSec=5s

# Security Sandboxing & Hardening Directives
ProtectSystem=strict
ProtectHome=true
NoNewPrivileges=true
PrivateTmp=true
PrivateDevices=true
ProtectKernelTunables=true
ProtectControlGroups=true
ReadWritePaths=/var/lib/loki

# Process Resource Ceilings
LimitNOFILE=65536
LimitNPROC=4096
LimitMEMLOCK=infinity
MemoryMax=4G

[Install]
WantedBy=multi-user.target
Create the corresponding Promtail unit file at /etc/systemd/system/promtail.service:
# /etc/systemd/system/promtail.service
[Unit]
Description=Promtail Log Collection Agent
Documentation=https://grafana.com/docs/loki/latest/clients/promtail/
After=network-online.target
Wants=network-online.target

[Service]
Type=simple
User=promtail
Group=systemd-journal
SupplementaryGroups=adm
ExecStart=/usr/local/bin/promtail -config.file=/etc/promtail/config.yml
Restart=always
RestartSec=5s

# Security Hardening
ProtectSystem=full
ProtectHome=true
NoNewPrivileges=true
PrivateTmp=true
ReadWritePaths=/var/lib/promtail

LimitNOFILE=65536
MemoryMax=1G

[Install]
WantedBy=multi-user.target
Reload the systemd daemon, initialize storage permissions, and start the logging stack:
sudo useradd --system --no-create-home --shell /sbin/nologin loki
sudo useradd --system --no-create-home --shell /sbin/nologin promtail
sudo mkdir -p /var/lib/loki /var/lib/promtail
sudo chown -R loki:loki /var/lib/loki
sudo chown -R promtail:promtail /var/lib/promtail

sudo systemctl daemon-reload
sudo systemctl enable --now loki
sudo systemctl enable --now promtail
Mastering LogQL: Queries, Line Filters, and Metrics Extraction
LogQL is Grafana Loki’s dedicated query language, heavily inspired by PromQL. It is structured into two core primitives: Log Queries (returning raw formatted streams) and Metric Queries (calculating numeric time-series values directly from log content).
1. Stream Selectors and Line Filtering
Always start queries with explicit stream label selectors to constrain search space before applying string operations:
# Match production API logs containing errors but excluding deprecation warnings
{job="app", app_name="core-api", env="production"} |= "error" != "deprecated"

# Regex matching 5xx HTTP response codes
{job="nginx"} |~ "HTTP/1\.[01]" 5[0-9]{2}"
2. Parsing and Label Extraction at Query Time
Loki can dynamically unpack JSON payloads or logfmt key-value pairs without pre-indexing individual attributes:
# Parse JSON log stream and filter by numeric duration field
{job="app"} | json | status_code >= 500 and response_time_ms > 1200
3. Metric Generation from Unindexed Logs
Transform unindexed log streams into real-time Grafana dashboard graphs using metric range aggregations:
# Calculate the per-second rate of 5xx errors over a 5-minute rolling window
sum by (service) (
rate({job="nginx"} |~ " 50[0-9] " [5m])
)
# Compute the 99th percentile response duration extracted from unstructured logs
quantile_over_time(0.99,
{job="nginx"}
| pattern ` - - [Architecture Note: When building alert rules from log data, metric queries should always be scoped with strict label boundaries. Executing unbounded regex sweeps across terabytes of chunk data can degrade query engine responsiveness during cluster-wide incident investigations.
Production Hardware Sizing, Retention Lifecycle, and Enterprise Deployment
While Loki drastically cuts RAM requirements compared to JVM-based alternatives, continuous high-velocity ingestion requires solid disk I/O characteristics. For a cluster handling 50 GB to 100 GB of compressed logs per day, we recommend the following baseline capacity:
- Compute: 4 to 8 dedicated vCPU cores to support parallel chunk compression and LogQL query worker routines.
- Memory: 8 GB to 16 GB of RAM, reserving ample space for OS page cache and ingester WAL buffers.
- Storage Throughput: Enterprise NVMe storage capable of delivering sustained 500+ MB/s sequential writes with low read latency during table compaction passes.
When transitioning beyond local developer prototypes and staging servers to mission-critical production monitoring, physical infrastructure quality dictates your cluster’s resilience. For high-throughput observability stacks demanding predictable I/O, consider hosting your workloads on MeraHost Enterprise Cloud. Backed by pure enterprise NVMe arrays, high-frequency compute cores, and LiteSpeed Web Server acceleration, MeraHost guarantees transparent pricing with the Same Renewal Price, Always (starting at ₹99/mo) and zero sudden renewal price hikes.
Frequently Asked Questions (FAQs)
How does Grafana Loki handle out-of-order log entries?
Historically, Loki rejected logs arriving out of chronological order within a single stream. Modern Loki releases (v2.4+) feature native out-of-order ingestion support. By configuring unordered_writes: true under the limits_config block and specifying a max_chunk_age, Loki buffers and sorts out-of-order streams within the WAL prior to flushing immutable chunks.
What is the primary difference between LogQL line filters and parser stages?
Line filters (e.g., |= "pattern" or != "string") perform raw, lightning-fast byte string matching across log lines before decompression overhead accumulates. Parser stages (such as | json, | logfmt, or | regexp) unpack structured attributes into queryable parameters. For maximum query speed, always place fast line filters before parser stages in your LogQL pipeline.
How does the Loki Compactor enforce log retention without data corruption?
The Loki Compactor service runs background sweeps at scheduled intervals (configured via compaction_interval). It inspects TSDB index tables and chunk timestamps against the configured retention_period. Expired chunks are marked for deletion and subsequently purged from filesystem or object storage after a safety delay (retention_delete_delay), ensuring in-flight queries complete without encountering missing chunk errors.
Can I generate alerting rules directly from Loki log streams?
Yes. Loki features a built-in Ruler component that executes LogQL metric queries on a schedule and fires alerts directly to Alertmanager. Additionally, Grafana Alerting can evaluate LogQL queries natively from the dashboard UI, triggering notifications to Slack, PagerDuty, or webhooks whenever error thresholds are breached.
Deploy Enterprise-Grade Production Infrastructure
Need guaranteed performance with zero price hikes? Host mission-critical workloads on MeraHost with pure Enterprise NVMe, LiteSpeed Web Server, and Same Renewal Price, Always (starting at ₹99/mo).