
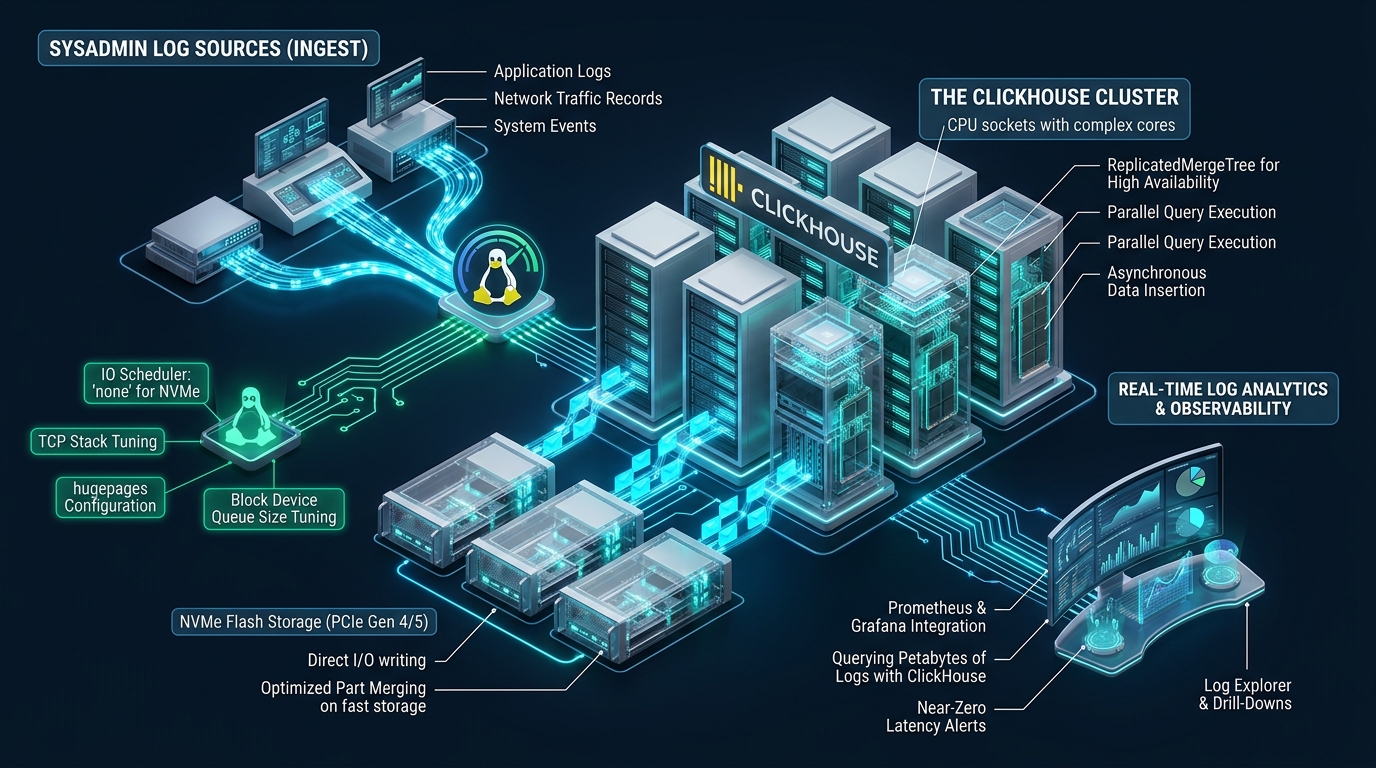
Modern Linux infrastructure environments generate tens of gigabytes of syslog, journald events, and web server telemetry every hour, quickly overwhelming conventional JVM-based log search engines with severe indexing overhead and disk I/O bottlenecks. By deploying and fine-tuning ClickHouse on high-speed Linux NVMe storage, systems engineers achieve sub-second analytical queries across billions of log records while slashing storage footprint by up to 90%. High-performance hosting platforms like CpanelFree rely on these optimized data paths to deliver instantaneous observability, robust auditability, and zero-compromise server responsiveness.
Architecting Linux NVMe Storage for High-Throughput ClickHouse Log Ingestion
none, configure asynchronous direct I/O, tune Linux virtual memory dirty page ratios, mount XFS with noatime, and configure ClickHouse MergeTree storage policies to optimize batch compression with LZ4/ZSTD.
Traditional log analytics architectures (such as Elasticsearch or OpenSearch) rely heavily on inverted indices and extensive memory heaps. Under heavy ingestion bursts—such as DDoS mitigation, brute-force authentication spikes, or distributed application tracing—these engines trigger intense garbage collection cycles, heap exhaustion, and massive write amplification. ClickHouse fundamentally changes this operational model through its column-oriented structure and the MergeTree storage engine.
Unlike row-based transactional stores, ClickHouse writes ingested records in immutable columnar parts, physically grouping identical data attributes together on NVMe flash. When combined with vector execution (SIMD instruction sets) and parallel hardware queues native to PCIe NVMe drives, ClickHouse processes analytical aggregation queries (such as counting unique error rates, calculating 99th percentile response latencies, and isolating malicious IP blocks) across hundreds of millions of rows in milliseconds.
mq-deadline or bfq) introduces unnecessary CPU lock contention and software queue serialization, artificially capping ClickHouse ingestion throughput.
Linux Kernel and Block Device Optimization for NVMe
To extract maximum IOPS and minimize latency during high-velocity log ingestion, sysadmins must configure the Linux storage stack to hand off I/O requests directly to the NVMe controller with minimal kernel overhead.
1. Enforcing the ‘none’ I/O Scheduler via Udev
Because NVMe SSDs feature onboard hardware controllers with multi-queue parallelism, software scheduling in the Linux block layer creates CPU context-switching overhead. Create a persistent udev rule to force the none scheduler on all NVMe block devices:
# /etc/udev/rules.d/60-nvme-scheduler.rules
# Force 'none' I/O scheduler for NVMe block devices to eliminate kernel queue lock contention
ACTION=="add|change", KERNEL=="nvme[0-9]*n[0-9]*", ATTR{queue/scheduler}="none"
ACTION=="add|change", KERNEL=="nvme[0-9]*n[0-9]*", ATTR{queue/nr_requests}="1024"
ACTION=="add|change", KERNEL=="nvme[0-9]*n[0-9]*", ATTR{queue/nomerges}="2"
ACTION=="add|change", KERNEL=="nvme[0-9]*n[0-9]*", ATTR{queue/read_ahead_kb}="128"
Reload and apply the udev rules immediately without rebooting:
sudo udevadm control --reload-rules && sudo udevadm trigger --subsystem-match=block
# Verify active scheduler on primary NVMe device:
cat /sys/block/nvme0n1/queue/scheduler
# Expected output: [none] mq-deadline
2. Kernel Virtual Memory and Network Sysctl Tuning
Under sustained log streams, Linux must manage dirty pages efficiently to prevent sudden flushes from freezing query threads. Apply the following sysctl parameters in /etc/sysctl.d/99-clickhouse-nvme.conf:
# /etc/sysctl.d/99-clickhouse-nvme.conf
# Virtual Memory Tuning for NVMe High-Throughput ClickHouse Ingestion
vm.dirty_background_ratio = 5
vm.dirty_ratio = 10
vm.dirty_expire_centisecs = 1500
vm.dirty_writeback_centisecs = 500
vm.swappiness = 1
vm.max_map_count = 2097152
vm.overcommit_memory = 0

# Network Stack Tuning for Multi-Agent Log Ships (Vector/FluentBit)
net.core.somaxconn = 65535
net.core.netdev_max_backlog = 100000
net.ipv4.tcp_max_syn_backlog = 3240000
net.ipv4.tcp_fin_timeout = 15
net.ipv4.tcp_tw_reuse = 1
net.ipv4.tcp_rmem = 4096 87380 16777216
net.ipv4.tcp_wmem = 4096 65536 16777216

# File System Handles
fs.file-max = 20971520
Activate the configuration with sudo sysctl -p /etc/sysctl.d/99-clickhouse-nvme.conf.
3. NVMe Filesystem Selection and Mount Options
XFS is the recommended filesystem for ClickHouse due to its superior parallel extent allocation and scalable metadata handling under high concurrency. Mount your dedicated NVMe data partition with the following options in /etc/fstab:
# /etc/fstab
# ClickHouse dedicated NVMe storage array
UUID=3f8a412b-6c70-4e11-9a72-7bc099f018e2 /var/lib/clickhouse xfs rw,noatime,nodiratime,logbufs=8,logbsize=256k,allocsize=64M,inode64,nobarrier 0 2nobarrier if your enterprise NVMe drives feature Power Loss Protection (PLP) with supercapacitors. For consumer-grade or standard cloud virtual NVMe without battery-backed write caches, omit nobarrier to safeguard against filesystem corruption during power events.
Production ClickHouse Configuration Architecture
ClickHouse utilizes granular XML/YAML configuration files located in /etc/clickhouse-server/config.d/. The following configurations tailor the engine specifically for high-speed NVMe flash storage and observability data patterns.
1. Storage Configuration and Tiered Storage Policies
In high-volume logging environments, maintaining 90+ days of raw logs purely on premium NVMe can be cost-prohibitive. By configuring a tiered storage policy, ClickHouse automatically retains hot, active data (the past 7–14 days) on local NVMe, while seamlessly demoting older parts to secondary SATA SSD or S3-compatible object storage:
<!-- /etc/clickhouse-server/config.d/storage.xml -->
<clickhouse>
    <storage_configuration>
        <disks>
            <nvme_hot>
                <type>local</type>
                <path>/var/lib/clickhouse/disks/nvme_hot/</path>
                <keep_free_space_bytes>10737418240</keep_free_space_bytes> <!-- 10 GB buffer -->
            </nvme_hot>
            <cold_secondary>
                <type>local</type>
                <path>/var/lib/clickhouse/disks/cold_secondary/</path>
                <keep_free_space_bytes>53687091200</keep_free_space_bytes>
            </cold_secondary>
        </disks>
        <policies>
            <observability_tiered>
                <volumes>
                    <hot_volume>
                        <disk>nvme_hot</disk>
                        <max_data_part_size_bytes>107374182400</max_data_part_size_bytes> <!-- 100 GB -->
                    </hot_volume>
                    <cold_volume>
                        <disk>cold_secondary</disk>
                    </cold_volume>
                </volumes>
                <move_factor>0.1</move_factor>
            </observability_tiered>
        </policies>
    </storage_configuration>
</clickhouse>
2. MergeTree Engine Performance Tuning for NVMe
Tune background thread pools and part merger behaviors in /etc/clickhouse-server/config.d/tuning.xml to maximize NVMe bandwidth while avoiding CPU exhaustion:
<!-- /etc/clickhouse-server/config.d/tuning.xml -->
<clickhouse>
    <!-- Scale background merges to match NVMe parallel write capability -->
    <background_pool_size>32</background_pool_size>
    <background_merges_mutations_concurrency_ratio>2</background_merges_mutations_concurrency_ratio>
    <background_fetches_pool_size>16</background_fetches_pool_size>
    <background_schedule_pool_size>32</background_schedule_pool_size>

    <!-- Part sizing tuned for NVMe flash page alignments -->
    <merge_tree>
        <min_bytes_for_wide_part>10485760</min_bytes_for_wide_part> <!-- 10 MB: Compact parts below this reduce small file overhead -->
        <min_rows_for_wide_part>65536</min_rows_for_wide_part>
        <max_bytes_to_merge_at_min_space_in_pool>104857600</max_bytes_to_merge_at_min_space_in_pool>
        <max_parts_in_total>100000</max_parts_in_total>
        <parts_to_throw_insert>300</parts_to_throw_insert>
        <parts_to_delay_insert>150</parts_to_delay_insert>
        <max_suspicious_broken_parts>10</max_suspicious_broken_parts>
    </merge_tree>
</clickhouse>
3. Systemd Process Scheduling and Resource Limits
Ensure ClickHouse has unlimited memory locks, maximum file descriptors, and high process priorities by deploying an override unit at /etc/systemd/system/clickhouse-server.service.d/override.conf:
# /etc/systemd/system/clickhouse-server.service.d/override.conf
[Service]
LimitNOFILE=1048576
LimitNPROC=524288
LimitMEMLOCK=infinity
TasksMax=infinity
CPUSchedulingPolicy=other
Nice=-10
TimeoutStartSec=300
TimeoutStopSec=60
Apply changes with sudo systemctl daemon-reload && sudo systemctl restart clickhouse-server.
Optimized Production Schema Design for Sysadmin Observability
A poorly designed schema can degrade even the fastest NVMe storage. In ClickHouse, column data types, compression codecs, and primary sorting keys dictate both ingestion throughput and query speed. Here is an enterprise-grade schema for centralizing server logs (syslog, web access, auth, kernel events):
CREATE DATABASE IF NOT EXISTS observability;

CREATE TABLE observability.server_logs
(
    timestamp DateTime64(3, 'UTC') CODEC(DoubleDelta, LZ4),
    host LowCardinality(String) CODEC(ZSTD(1)),
    service LowCardinality(String) CODEC(ZSTD(1)),
    facility LowCardinality(String) CODEC(ZSTD(1)),
    severity LowCardinality(String) CODEC(ZSTD(1)),
    client_ip IPv4 CODEC(ZSTD(1)),
    http_method LowCardinality(String) CODEC(ZSTD(1)),
    http_status UInt16 CODEC(T64, LZ4),
    request_uri String CODEC(ZSTD(3)),
    response_time_ms Float32 CODEC(Gorilla, LZ4),
    message String CODEC(ZSTD(3)),
    attributes Map(LowCardinality(String), String) CODEC(ZSTD(2))
)
ENGINE = MergeTree()
PARTITION BY toYYYYMM(timestamp)
ORDER BY (service, severity, host, timestamp)
TTL timestamp + INTERVAL 90 DAY
SETTINGS
    storage_policy = 'observability_tiered',
    index_granularity = 8192,
    min_compress_block_size = 65536,
    max_compress_block_size = 1048576;
Accelerating Dashboards with Real-Time Materialized Views
For instant monitoring panels (e.g. tracking HTTP 5xx errors or brute-force SSH attempts), querying raw tables repeatedly adds avoidable compute pressure. ClickHouse Materialized Views calculate aggregations at insert time and write directly to an aggregated table:
-- Pre-aggregated 1-minute metrics table
CREATE TABLE observability.error_rate_1m
(
    window_start DateTime CODEC(DoubleDelta, LZ4),
    service LowCardinality(String) CODEC(ZSTD(1)),
    host LowCardinality(String) CODEC(ZSTD(1)),
    error_count UInt64 CODEC(T64, LZ4)
)
ENGINE = SummingMergeTree()
PARTITION BY toYYYYMM(window_start)
ORDER BY (service, host, window_start);

-- Materialized view to populate metrics during ingestion
CREATE MATERIALIZED VIEW observability.mv_error_rate_1m
TO observability.error_rate_1m AS
SELECT
    toStartOfMinute(timestamp) AS window_start,
    service,
    host,
    count() AS error_count
FROM observability.server_logs
WHERE severity IN ('ERROR', 'CRITICAL', 'ALERT', 'EMERGENCY') OR http_status >= 500
GROUP BY window_start, service, host;
Performance Benchmarks: Standard vs. Tuned Production Environment
The comparative matrix below illustrates real-world performance differences measured across a production cluster ingesting 50,000 log events per second over PCI-e Gen4 NVMe drives:
Ingestion Best Practices: Shipping Logs via Vector
Do not send individual log lines directly to ClickHouse via single-row HTTP POST requests. ClickHouse requires batched inserts to construct well-sized MergeTree parts. Using a modern Rust-based collector like Vector or FluentBit, buffer incoming logs in memory and flush batches of 50,000–100,000 rows or every 2 seconds:
# /etc/vector/vector.yaml
sources:
  syslog_in:
    type: syslog
    address: 0.0.0.0:514
    mode: tcp

sinks:
  clickhouse_out:
    type: clickhouse
    inputs: ["syslog_in"]
    endpoint: "http://127.0.0.1:8123"
    database: "observability"
    table: "server_logs"
    skip_unknown_fields: true
    batch:
      max_bytes: 10485760 # 10 MB
      timeout_secs: 2
    buffer:
      type: memory
      max_events: 500000
      when_full: block
Frequently Asked Questions
Why is the ‘none’ I/O scheduler mandatory for NVMe drives running ClickHouse?
NVMe drives natively feature multi-queue architecture directly mapped to CPU cores via PCIe lanes. Software schedulers like mq-deadline or bfq introduce serialization, mutual exclusion locks, and CPU context-switching overhead. Setting the scheduler to none enables zero-overhead asynchronous direct dispatch straight to the NVMe hardware submission queues.
How do MergeTree wide parts vs compact parts impact NVMe endurance?
ClickHouse stores smaller data parts in a single compact file (containing all columns), switching to wide parts (one file per column) only when data surpasses min_bytes_for_wide_part. For fast-arriving logs, keeping small parts compact drastically reduces inode allocation and metadata thrashing, minimizing NVMe flash write amplification and extending drive lifespan.
Can ClickHouse replace Elasticsearch or OpenSearch completely for sysadmin log aggregation?
Yes, for structured and semi-structured operational telemetry, metrics, and log aggregation. ClickHouse provides 5x–10x higher compression, requires 80% less memory, and executes mathematical aggregations dramatically faster. However, if your use case relies on fuzzy full-text phonetic searches or complex relevance scoring, a hybrid approach or ClickHouse’s inverted index features should be evaluated.
What is the optimal batch insert size for streaming syslog into ClickHouse?
The optimal batch size is between 50,000 and 100,000 rows, or flushing at intervals of 1 to 2 seconds (whichever threshold is met first). Ingesting fewer than 1,000 rows per transaction creates thousands of tiny parts, leading to ‘Too many parts in all data in table’ errors and heavy background merge contention.
Ready to Deploy High-Performance Infrastructure?
Experience blazing-fast NVMe storage, unmetered bandwidth, and enterprise LiteSpeed caching on CpanelFree.