
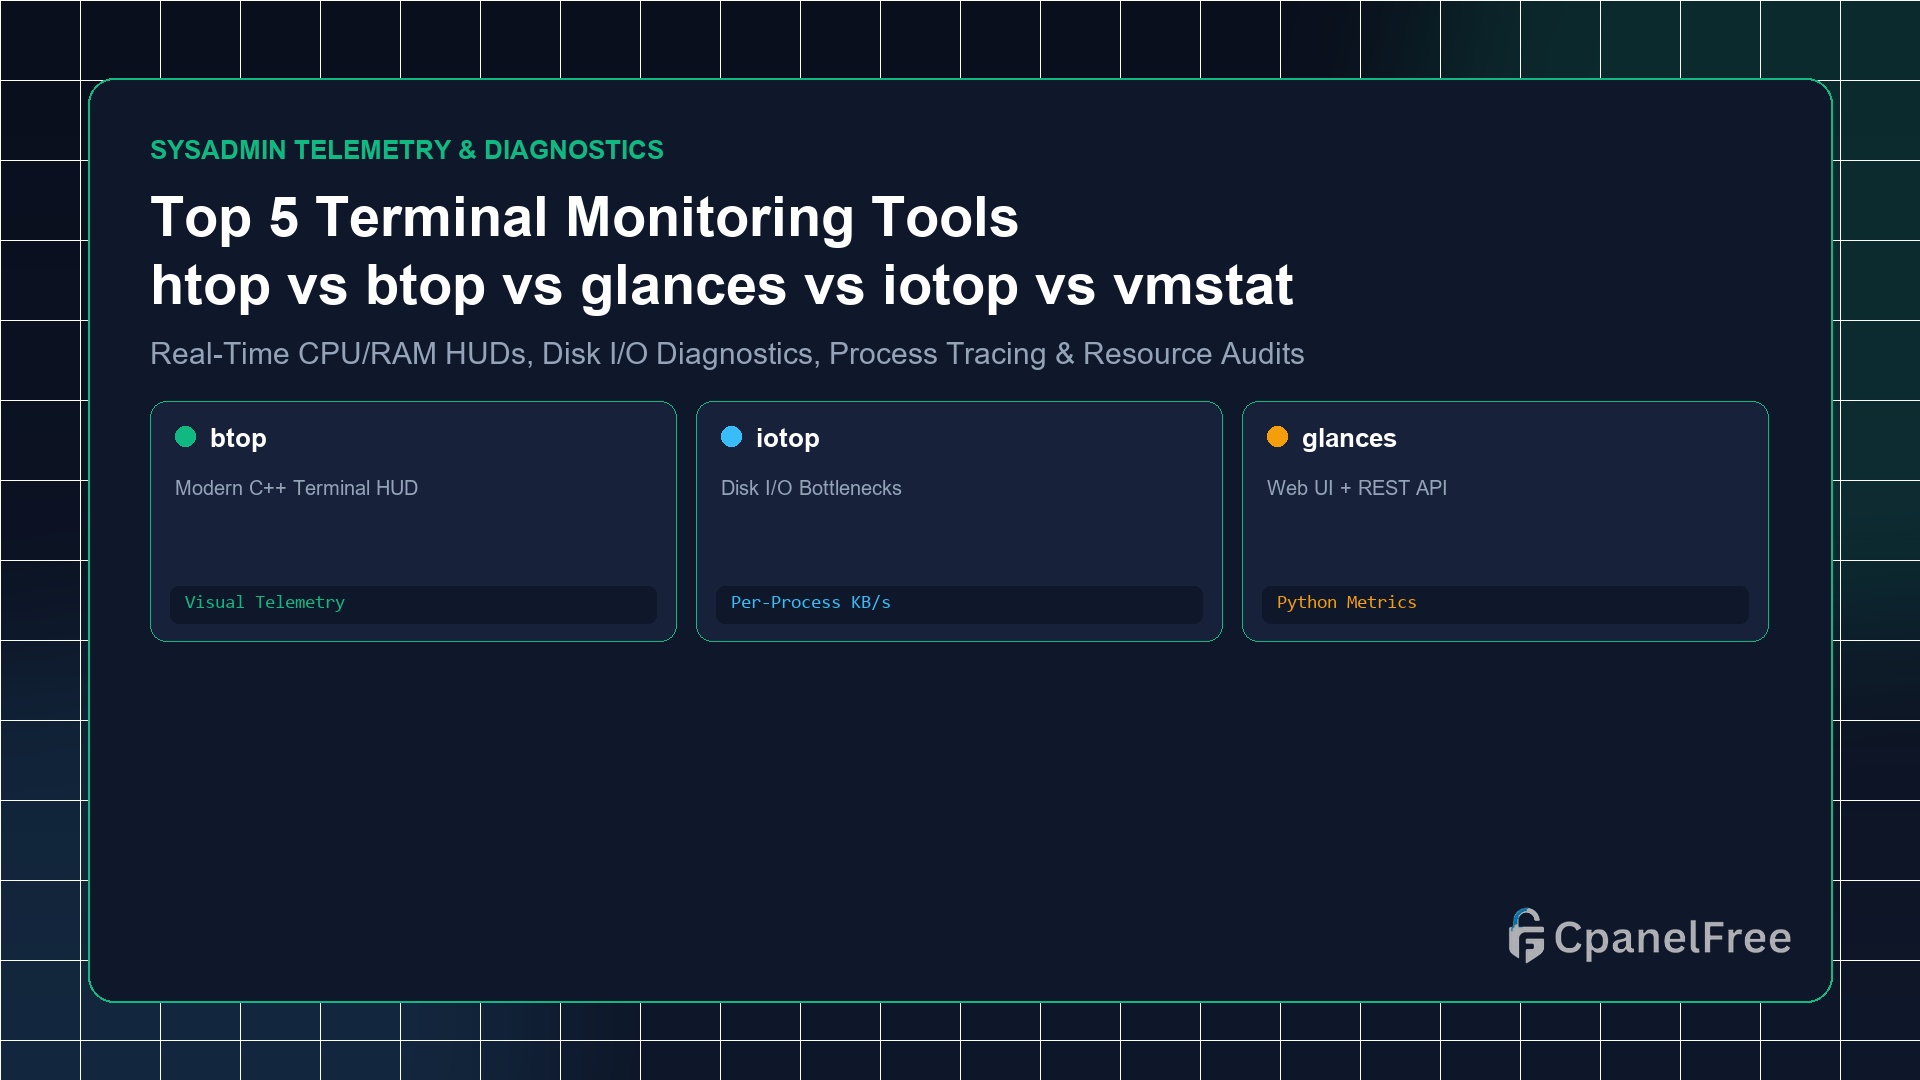
For daily interactive process management, htop is the essential baseline. For modern visual aesthetics with GPU, disk, and network graphs, use btop (sudo apt install btop). If you need per-process disk read/write bandwidth diagnosis, use iotop. To export metrics over a web interface or REST API, install glances. For lightweight zero-overhead kernel virtual memory analysis, run the built-in vmstat 1.
Why the Legacy top Command Is No Longer Enough
Every Linux distribution ships with the standard top utility. While functional, top lacks horizontal scrolling for long process arguments, provides no visual representation of per-core CPU load, cannot filter disk I/O per PID, and requires cryptic single-key shortcuts to kill runaway tasks.
When troubleshooting performance degradation on a production cloud VPS—such as high load averages, runaway PHP-FPM workers, rogue database queries, or disk I/O bottlenecks—having the right terminal telemetry HUD allows you to pinpoint the root cause within seconds rather than digging through raw text logs.
Tool 1: htop – The Gold-Standard Interactive Process Viewer
Written in C and relying on ncurses, htop is the universal replacement for top. It features full mouse support, color-coded per-CPU core meters, visual memory breakdown (resident vs cached), and interactive process tree viewing.
# Install htop on Ubuntu/Debian
sudo apt update && sudo apt install -y htop

# Launch htop
htop
Key Shortcuts: Press F5 for Tree View (parent-child relationships), F6 to sort by MEM% or CPU%, F9 to send SIGKILL/SIGTERM directly to a highlighted PID, and F4 to filter by name.
Tool 2: btop – Modern C++ Resource Monitor with Stunning Visuals
btop (and its predecessor btop++) is widely considered the most visually sophisticated terminal monitor in existence. Written in pure C++, it delivers rich ASCII/Unicode graphs for per-core frequencies, disk read/write throughput, download/upload network adapters, and running processes with zero configuration.
# Install btop
sudo apt install -y btop

# Launch btop
btop
Tool 3: iotop – Pinpointing Disk I/O Bottlenecks
High Linux load average is frequently caused not by CPU exhaustion, but by I/O wait (wa)—where processes freeze while waiting for slow disk read/write operations. iotop monitors Linux kernel I/O accounting to identify exactly which process is thrashing your disk.
# Install iotop
sudo apt install -y iotop

# Monitor only processes actively doing disk I/O (-o)
sudo iotop -o -d 1
This instantly exposes unindexed MySQL table scans or rogue backup scripts dumping hundreds of megabytes per second.
Tool 4: glances – Cross-Platform Monitor with Web UI & REST API
Developed in Python, glances monitors CPU, memory, network, disk, Docker containers, and system sensors. Its killer feature is running as a lightweight web server, allowing you to monitor your VPS from any web browser without maintaining an active SSH terminal.
# Install glances
sudo apt install -y glances

# Launch web server mode on port 61208
glances -w
Tool 5: vmstat – The Zero-Overhead Kernel Diagnostics Engine
When a server is under severe distress and heavier utilities cannot even launch, vmstat (Virtual Memory Statistics) provides instant kernel metrics on process run queues (r), blocked processes (b), swap in/out (si/so), and CPU context switches (cs).
# Display updates every 1 second
vmstat 1 10
Feature & Architecture Comparison Table
| Tool | Primary Specialty | RAM Usage | Disk I/O Detail | Docker Container Support |
|---|---|---|---|---|
| htop | Process management & signaling | ~4 MB | Basic | No |
| btop | Full visual hardware HUD | ~14 MB | High (live graphs) | No |
| iotop | Disk I/O read/write per PID | ~18 MB (Python) | Best in Class | No |
| glances | Remote Web UI & Prometheus export | ~35 MB | Moderate | Yes (Native) |
| vmstat | Kernel memory & run queues | < 1 MB | Summary blocks | No |
Frequently Asked Questions (FAQ)
Why does top/htop show 100% CPU on 1 core when I have 4 cores?
In standard Linux tools, 100% CPU indicates that a single hardware thread/core is fully saturated. On a 4-core server, maximum total utilization is 400%. If a single process shows 100%, that application is single-threaded and bottlenecking on one CPU core.
What is a healthy load average on Linux?
A load average equal to your number of CPU cores represents 100% capacity without queueing delays. On a 2-core VPS, a load average below 2.0 indicates healthy capacity. A load above 2.0 means processes are waiting in the kernel run queue.
🔗 Recommended Related Technical Guides
Customizing htop Configuration: Creating Custom Column Profiles
Many sysadmins are unaware that htop settings can be persisted permanently by editing ~/.config/htop/htoprc. Customizing your default layout allows you to monitor critical operational metrics (such as CPU I/O wait, memory buffers, and resident set size) the moment you open the terminal:
# Recommended htop customizations in ~/.config/htop/htoprc
fields=0 48 17 18 38 39 40 2 46 47 49 1
sort_key=46
sort_direction=-1
tree_view=0
header_margin=1
detailed_cpu_time=1
show_cpu_frequency=1
show_cpu_temperature=1
Enabling detailed_cpu_time=1 differentiates between user processes, system kernel tasks, soft IRQs, and I/O wait with distinct color codes, allowing you to instantly determine whether high load is caused by database queries or hardware drive throttling.
Automating High Load Alert Scripts with Bash & Webhooks
While interactive terminal monitors are essential when logged in, production servers require automated alerting when CPU or memory thresholds are breached. You can deploy a lightweight bash watchdog script via crontab that triggers alerts to a Discord or Slack webhook:
#!/bin/bash
# Check 1-minute load average
LOAD=$(awk '{print $1}' /proc/loadavg | cut -d. -f1)
CORES=$(nproc)
THRESHOLD=$((CORES * 2))

if [ "$LOAD" -ge "$THRESHOLD" ]; then
  MESSAGE="⚠️ High Load Alert on $(hostname): Current load is ${LOAD} across ${CORES} CPU cores!"
  # Dispatch to webhook or email notification
  curl -s -X POST -H 'Content-type: application/json'     --data "{\"text\":\"$MESSAGE\"}" YOUR_WEBHOOK_URL
fi
Monitor High-Performance Cloud VPS on CpanelFree
Experience unthrottled dedicated CPU performance and lightning-fast NVMe read/write speeds on CpanelFree cloud servers.