
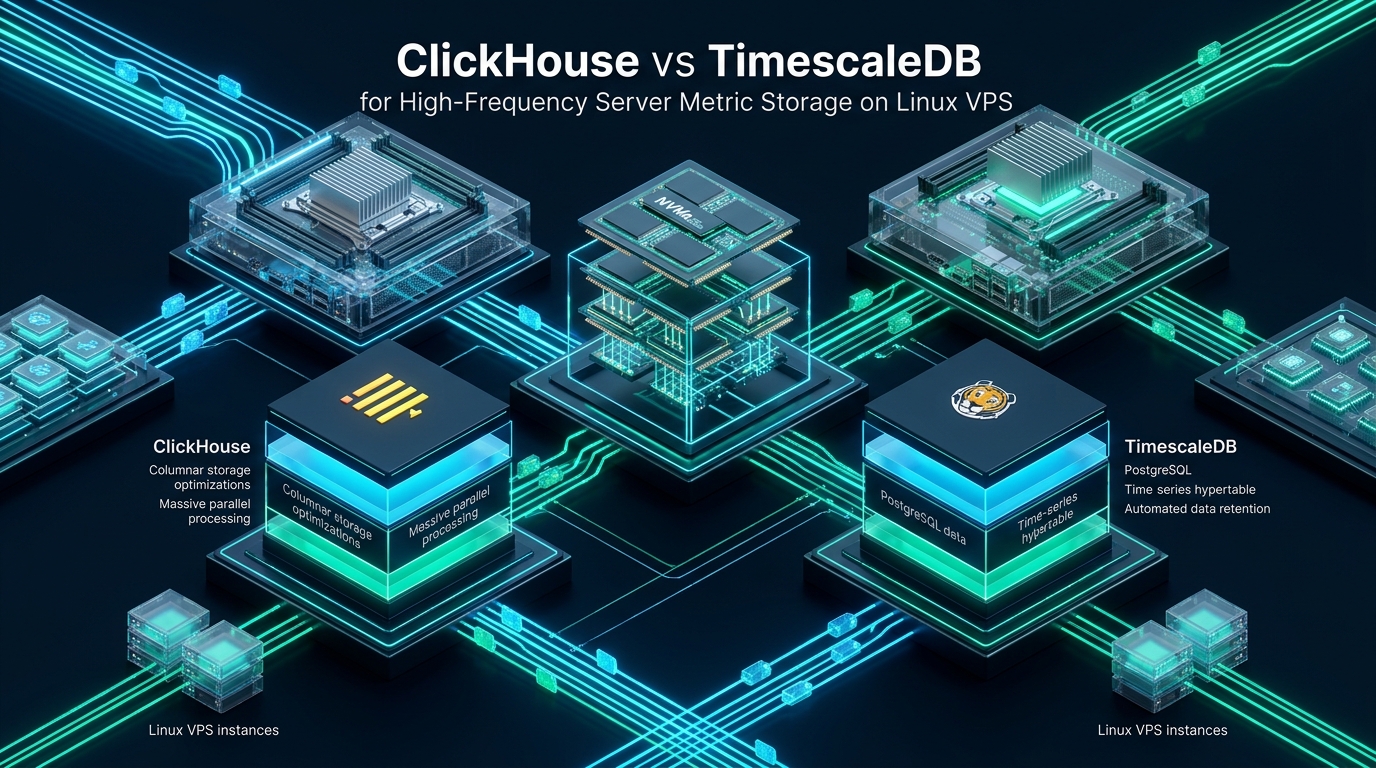
Ingesting hundreds of thousands of server telemetry samples per second on resource-constrained Linux VPS instances inevitably exposes the architectural trade-offs between pure columnar engines and relational time-series extensions. While traditional relational setups buckle under excessive write amplification and locking overhead during peak observability bursts, modern cloud stacks deployed on CpanelFree require lean, deterministic I/O throughput to preserve CPU cycles for production workloads. Choosing between ClickHouse’s vectorized columnar storage and TimescaleDB’s hypertables defines whether your infrastructure monitoring scales seamlessly or collapses under disk saturation.
Architectural Verdict: ClickHouse vs TimescaleDB for High-Frequency Metrics
Systems architects managing telemetry streams from thousands of virtual hosts, container pods, and application runtimes encounter a severe data gravity problem. Metrics collected at sub-second intervals—such as CPU state registers, socket buffer allocations, context switches, and per-cgroup disk latency—generate billions of rows weekly. On a Linux VPS with constrained RAM and provisioned NVMe IOPS, inefficient database engines quickly deplete storage bandwidth, triggering I/O wait cascades that degrade adjacent services.
To establish which database provides true enterprise-grade telemetry ingestion, we examine their underlying storage primitives, data compression algorithms, Linux kernel tuning requirements, and analytical query characteristics.
Core Storage Primitives: Columnar Vectorization vs Relational Hypertables
The architectural divergence between ClickHouse and TimescaleDB begins at the disk storage layout. ClickHouse is built from the ground up as a shared-nothing, columnar analytical database (OLAP), whereas TimescaleDB is engineered as an extension to PostgreSQL, augmenting the classic relational engine with automated time-partitioned tables known as hypertables.
ClickHouse utilizes the MergeTree engine family. When metrics arrive, ClickHouse writes them sequentially in sorted batches to immutable disk parts. A background compaction process continuously merges these parts in an LSM-tree (Log-Structured Merge-tree) fashion. This design eliminates in-place data updates and random disk writes, ensuring that write operations on NVMe storage operate near theoretical sequential write limits.
TimescaleDB relies on the PostgreSQL write-ahead log (WAL) and MVCC (Multi-Version Concurrency Control) storage architecture. While this provides strict ACID transactional integrity and seamless foreign-key constraints to relational tables (such as server metadata, customer billing records, and inventory catalogs), each row insertion involves writing to heap blocks and updating multiple secondary indexes. TimescaleDB mitigates this overhead through its hypertable abstraction, ensuring individual chunks fit within PostgreSQL’s shared_buffers to avoid cache eviction thrashing.
Comparative Performance Matrix: Production Metric Ingestion
Data Compression Mechanics: Squeezing Terabytes into VPS NVMe Disks
Server metrics are predominantly structured as timestamps, numerical gauge or counter values, and categorical string labels (hostname, datacenter, service ID, cgroup path). Storing these values efficiently requires purpose-built codec algorithms rather than generic filesystem compression.
ClickHouse allows engineers to define granular compression codecs per column:
- DoubleDelta: Encodes the delta of deltas between successive timestamps or monotonically increasing counter metrics (e.g., network bytes transmitted). When samples arrive at regular intervals (e.g., 10-second polling), delta-of-delta values collapse to zero, consuming as little as 1 bit per sample.
- Gorilla: Designed by Facebook engineers for 64-bit floating-point metrics, Gorilla XORs successive values. When CPU percentages or memory metrics fluctuate within narrow ranges, leading and trailing zeros compress with extreme efficiency.
- ZSTD / LZ4: Secondary block-level compression applied over the already vectorized and encoded columns.
TimescaleDB implements similar compression algorithms—Gorilla for floats, delta-of-delta for integers/timestamps, and dictionary encoding for recurring strings. However, TimescaleDB applies these codecs retroactively via background chunk compression policies. As a consequence, recent telemetry remains in uncompressed row format for hours or days, temporarily consuming significantly more uncompressed disk space and I/O bandwidth during high-frequency ingestion bursts.
Linux Kernel Tuning for High-Frequency Metric Storage
Deploying high-frequency telemetry engines on a Linux VPS requires reconfiguring the kernel’s virtual memory subsystem, dirty page flushes, and socket backlogs. The default Linux kernel values are tuned for general-purpose desktop or multi-tenant web workloads, which cause severe latency spikes when database processes flush gigabytes of dirty cache to disk.
Apply the following production sysctl configuration to /etc/sysctl.d/99-metric-db.conf to maintain smooth, non-blocking I/O queues:
# /etc/sysctl.d/99-metric-db.conf - Enterprise Telemetry Database Kernel Tuning

# Minimize kernel swapping aggressively on VPS instances
vm.swappiness = 1
vm.vfs_cache_pressure = 50

# Start asynchronous background writeback early to avoid large I/O stalls
vm.dirty_background_ratio = 3
vm.dirty_ratio = 10

# Flush dirty memory pages every 15 seconds
vm.dirty_writeback_centisecs = 1500
vm.dirty_expire_centisecs = 3000

# Increase max open file descriptors for large LSM-tree merge operations
fs.file-max = 2097152
fs.nr_open = 2097152

# Expand network socket queue limits for high-frequency UDP/TCP metrics
net.core.somaxconn = 65535
net.core.netdev_max_backlog = 16384
net.core.rmem_default = 262144
net.core.rmem_max = 16777216
net.core.wmem_default = 262144
net.core.wmem_max = 16777216

# TCP keepalive and memory buffers for persistent telemetry agents
net.ipv4.tcp_rmem = 4096 87380 16777216
net.ipv4.tcp_wmem = 4096 65536 16777216
net.ipv4.tcp_fin_timeout = 15
net.ipv4.tcp_tw_reuse = 1
Activate the configuration immediately without rebooting:
sudo sysctl --systemProduction Engine Configuration Blueprints
Below are real-world, battle-tested configuration blueprints tailored for a Linux VPS running ClickHouse or TimescaleDB.
1. ClickHouse Metric Server Configuration
Place this custom override in /etc/clickhouse-server/config.d/metric-tuning.xml to restrict RAM consumption on a 4-vCPU, 8GB RAM VPS, while optimizing part-merging speed:
<clickhouse>
    <!-- Cap max RAM usage to 70% of total VPS memory to prevent OOM kills -->
    <max_server_memory_usage>5700000000</max_server_memory_usage>
    <max_server_memory_usage_to_ram_ratio>0.70</max_server_memory_usage_to_ram_ratio>

    <!-- MergeTree background tuning -->
    <merge_tree>
        <max_suspicious_broken_parts>10</max_suspicious_broken_parts>
        <parts_to_delay_insert>150</parts_to_delay_insert>
        <parts_to_throw_insert>300</parts_to_throw_insert>
        <max_delay_to_insert>1</max_delay_to_insert>
        <max_part_removal_threads>2</max_part_removal_threads>
    </merge_tree>

    <!-- Enable native Prometheus remote_write protocol handler -->
    <prometheus>
        <endpoint>/metrics</endpoint>
        <port>9363</port>
        <metrics>true</metrics>
        <events>true</events>
        <asynchronous_metrics>true</asynchronous_metrics>
    </prometheus>
</clickhouse>
Next, define an optimized metric table schema using ClickHouse codecs:
CREATE TABLE IF NOT EXISTS telemetry.node_metrics (
    timestamp DateTime64(3, 'UTC') CODEC(DoubleDelta, ZSTD(1)),
    host_id LowCardinality(String) CODEC(ZSTD(1)),
    metric_name LowCardinality(String) CODEC(ZSTD(1)),
    metric_value Float64 CODEC(Gorilla, ZSTD(1)),
    tags Map(LowCardinality(String), String) CODEC(ZSTD(1))
)
ENGINE = MergeTree()
PARTITION BY toYYYYMM(timestamp)
PRIMARY KEY (metric_name, host_id)
ORDER BY (metric_name, host_id, timestamp)
TTL toDateTime(timestamp) + INTERVAL 90 DAY DELETE;
2. TimescaleDB (PostgreSQL 16) Configuration
Configure /etc/postgresql/16/main/conf.d/timescaledb-tuning.conf to dedicate proper buffer pools and background workers for hypertable compression:
# /etc/postgresql/16/main/conf.d/timescaledb-tuning.conf

# Memory allocation for 8GB RAM Linux VPS
shared_buffers = 2GB
effective_cache_size = 5GB
maintenance_work_mem = 512MB
work_mem = 32MB

# Checkpoint & WAL tuning for steady high-frequency writes
checkpoint_completion_target = 0.9
max_wal_size = 8GB
min_wal_size = 1GB
wal_compression = zstd
wal_buffers = 64MB

# Worker processes for hypertable compression & continuous aggregates
timescaledb.max_background_workers = 6
max_worker_processes = 8
max_parallel_workers_per_gather = 2
max_parallel_workers = 4

# Disable synchronous commit to maximize ingestion throughput
synchronous_commit = off
Initialize the hypertable with 1-day chunk intervals and enable segment compression:
-- Create hypertable and configure compression policy
CREATE TABLE node_metrics (
    time TIMESTAMPTZ NOT NULL,
    host_id TEXT NOT NULL,
    metric_name TEXT NOT NULL,
    metric_value DOUBLE PRECISION NOT NULL
);

SELECT create_hypertable('node_metrics', 'time', chunk_time_interval => INTERVAL '1 day');

-- Enable columnar compression partitioned by metric and host
ALTER TABLE node_metrics SET (
    timescaledb.compress,
    timescaledb.compress_segmentby = 'metric_name, host_id',
    timescaledb.compress_orderby = 'time DESC'
);

-- Automatically compress chunks older than 2 days
SELECT add_compression_policy('node_metrics', INTERVAL '2 days');

-- Automatically drop data older than 90 days
SELECT add_retention_policy('node_metrics', INTERVAL '90 days');synchronous_commit = off in PostgreSQL/TimescaleDB delivers a massive 300-400% ingestion speed increase by allowing WAL buffers to flush asynchronously. In telemetry pipelines, a sub-second loss of metrics during an abrupt kernel crash is an acceptable architectural trade-off for continuous multi-thousand RPS ingestion.
Query Latency, Materialized Views, and Downsampling
Storing millions of raw samples is meaningless if dashboard queries take ten seconds to render. In modern Grafana dashboards, queries typically compute 95th-percentile latencies, moving averages, or downsampled rates across thousands of nodes.
ClickHouse resolves analytical queries with SIMD-vectorized execution. When calculating an aggregate over 500 million rows, ClickHouse scans only the target columns (e.g., metric_value and timestamp), bypassing metadata and unaffected columns entirely. Furthermore, ClickHouse offers AggregatingMergeTree tables, which pre-aggregate state during part merges. Querying pre-aggregated states executes in milliseconds regardless of dataset size.
TimescaleDB tackles aggregation through Continuous Aggregates. Continuous aggregates automatically refresh materialized views in the background as new data enters hypertables. While powerful and fully standard SQL-compliant, querying uncompressed recent chunks in TimescaleDB requires scanning standard PostgreSQL heap pages, which incurs higher CPU cache misses than ClickHouse’s columnar buffers.
Operational Trade-offs on Linux VPS Deployments
When selecting your telemetry storage architecture, consider the following operational constraints:
- Write Batching Discipline: ClickHouse demands client-side batching (minimum 10,000 to 100,000 rows per insert block) or an intermediate buffer (such as Kafka, Vector, or ClickHouse Buffer tables). Single-row inserts will trigger the notorious “Too many parts” exception and freeze ingestion. TimescaleDB, by contrast, tolerates micro-batches and streaming individual rows far more gracefully.
- Update and Mutation Support: If your monitoring system requires retroactive deduplication, alert state tagging, or metadata enrichment updates, TimescaleDB’s standard PostgreSQL MVCC handles row-level updates effortlessly. ClickHouse mutations (via
ALTER TABLE ... UPDATE) are heavy, asynchronous operations intended for occasional data hygiene, not real-time updates. - Backup and Snapshot Footprint: Backing up a 100GB TimescaleDB instance utilizes standard
pgBackRestorpg_dumputilities. ClickHouse uses hard links viaclickhouse-backupto create atomic snapshots within seconds without duplicating disk blocks, offering substantial advantages when operating on VPS storage snapshots.
Native Accordion FAQs
Can I run ClickHouse and TimescaleDB together on the same Linux VPS?
Yes, through ClickHouse’s PostgreSQL foreign data wrapper (PostgreSQL table engine). You can store high-frequency time-series metrics in ClickHouse for blistering analytical aggregations, while joining them against relational customer and infrastructure metadata hosted in PostgreSQL/TimescaleDB.
Which database consumes fewer CPU cycles during idle monitoring states?
ClickHouse maintains a lighter idle footprint (~300MB RAM, <0.5% CPU) because it does not run autovacuum processes or complex transaction monitors. TimescaleDB relies on PostgreSQL background workers (autovacuum, checkpoint flushes, hypertable policy schedulers) that generate minor periodic CPU wakeups even when idle.
How does ClickHouse handle Prometheus remote_write without third-party proxies?
Modern versions of ClickHouse feature a built-in Prometheus remote_write handler. By enabling the prometheus endpoint in the XML configuration and creating a table with the Prometheus schema, Prometheus can write metric samples directly to ClickHouse over HTTP without requiring an external bridge like Promscale.
What is the best way to migrate from TimescaleDB to ClickHouse if ingestion exceeds VPS IOPS?
Use ClickHouse’s native postgresql() table function to pull historical chunks directly across the network into a MergeTree table. In parallel, redirect your telemetry collector (e.g., Vector, Telegraf, or Grafana Agent) to write to both engines during a 48-hour burn-in period before cutting over dashboard datasources.
Ready to Deploy High-Performance Infrastructure?
Experience blazing-fast NVMe storage, unmetered bandwidth, and enterprise LiteSpeed caching on CpanelFree.