
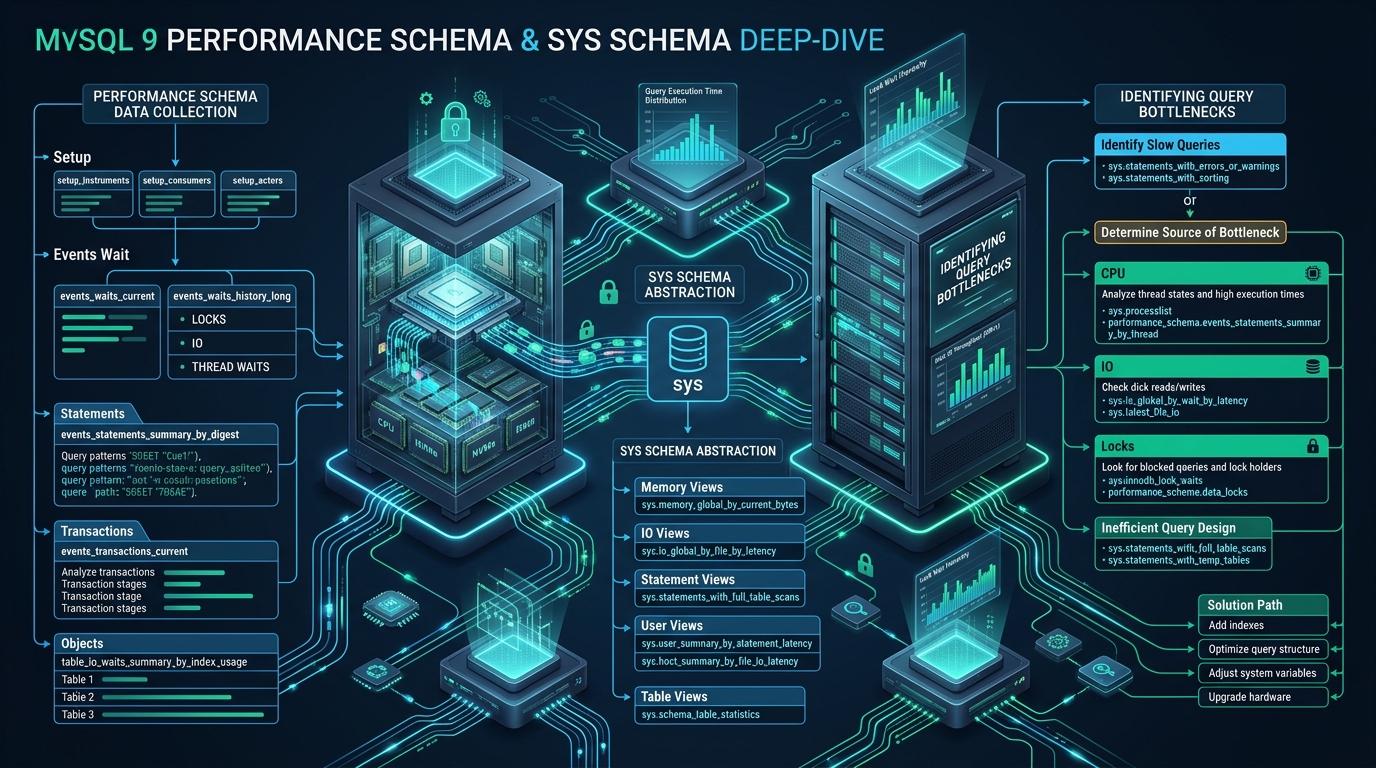
Diagnosing erratic latency spikes and hidden query bottlenecks in high-concurrency database workloads demands microscopic visibility into the database engine’s internal execution pipeline. At CpanelFree, our high-density cloud infrastructure handles millions of concurrent relational transactions, where even microsecond regressions in statement execution or lock acquisition cascade into severe throughput collapse. By mastering the unified instrumentation of MySQL 9’s Performance Schema alongside the curated abstractions of the Sys Schema, database engineers and systems architects can eliminate profiling guesswork and pinpoint resource starvation directly at the engine layer.
Direct Answer: How MySQL 9 Performance Schema Pinpoints Bottlenecks
1. Architectural Evolution: Performance Schema in MySQL 9
The Performance Schema in MySQL 9 represents an enterprise-grade execution audit framework that monitors server execution at runtime with minimal CPU overhead. Unlike the legacy slow query log or external packet sniffing daemons, the Performance Schema is embedded natively into the storage engine and optimizer layers. Instruments collect telemetry points throughout execution loops, registering data into fixed-size in-memory ring buffers without acquiring heavy global mutex locks.
MySQL 9 introduces refined memory instrumentation, enhanced telemetry for JSON execution plans, and streamlined consumer pipelines that dramatically reduce memory allocation overhead compared to earlier MySQL 8.0 iterations. However, running a production database with naive default Performance Schema settings often leads to incomplete diagnostic history or unnecessary memory overhead across tens of thousands of concurrent client connections.
CYCLE or NANOSECOND timer). Ensure your Linux kernel exposes the invariant TSC (Time Stamp Counter) CPU flag to eliminate timer drift across multicore NUMA nodes.
2. Comparative Matrix: Default vs. Tuned Production Profiling
Balancing observability against overhead is the primary objective when configuring MySQL 9 Performance Schema in high-throughput enterprise environments. Enabling every instrument indiscriminately can induce a 5% to 12% CPU penalty, whereas surgical configuration yields sub-1% overhead while capturing 100% of actionable bottleneck metrics.
3. Production Configuration: /etc/mysql/conf.d/99-perf-schema.cnf
To establish enterprise-grade observability without degrading performance, deploy the following production configuration file to your MySQL 9 instance. This configuration sizes statement digests appropriately, enables essential transaction and stage consumers, and constrains memory allocation limits.
# /etc/mysql/conf.d/99-perf-schema-production.cnf
# Enterprise MySQL 9 Performance Schema Optimization Profile

[mysqld]
# Enable Performance Schema engine core
performance_schema = ON

# Statement Digest and History Sizing
performance_schema_digests_size = 10000
performance_schema_max_digest_length = 4096
performance_schema_events_statements_history_size = 50
performance_schema_events_statements_history_long_size = 10000

# Stage & Transaction Instrumentation Sizing
performance_schema_events_stages_history_size = 20
performance_schema_events_stages_history_long_size = 5000
performance_schema_events_transactions_history_size = 20
performance_schema_events_transactions_history_long_size = 5000

# Memory Instrument Allocation Limits
performance_schema_max_memory_classes = 450
performance_schema_max_thread_classes = 100

# Targeted Instrument Activation at Startup
# Instrument statement execution, transaction boundaries, and wait states
performance-schema-instrument = 'statement/%=ON'
performance-schema-instrument = 'transaction/%=ON'
performance-schema-instrument = 'wait/io/file/%=ON'
performance-schema-instrument = 'wait/io/table/%=ON'
performance-schema-instrument = 'wait/lock/table/%=ON'
performance-schema-instrument = 'wait/lock/metadata/sql/mdl=ON'
performance-schema-instrument = 'wait/synch/mutex/innodb/%=ON'
performance-schema-instrument = 'stage/sql/%=ON'

# Targeted Consumer Activation
performance-schema-consumer-events-statements-current = ON
performance-schema-consumer-events-statements-history = ON
performance-schema-consumer-events-statements-history-long = ON
performance-schema-consumer-events-transactions-current = ON
performance-schema-consumer-events-transactions-history = ON
performance-schema-consumer-events-stages-current = ON
performance-schema-consumer-events-stages-history = ON
performance-schema-consumer-statements-digest = ON
performance-schema-consumer-global-instrumentation = ON
performance-schema-consumer-thread-instrumentation = ON
To complement database telemetry with low-latency kernel block I/O scheduling, apply the following Linux kernel sysctl profile to prevent page cache thrashing under sustained write pressure:
# /etc/sysctl.d/99-mysql-storage.conf
# Linux Kernel Memory & Storage Tuning for MySQL 9 NVMe Instances

# Prevent kernel background dirty page flush storms
vm.dirty_background_ratio = 5
vm.dirty_ratio = 10

# Reduce aggressiveness of kernel swap behavior
vm.swappiness = 1

# Expand maximum incoming network socket queue length
net.core.somaxconn = 65535

# Memory overcommit settings for high-density buffer pools
vm.overcommit_memory = 0

# Increase max file descriptors
fs.file-max = 2097152
4. Diagnosing Query Bottlenecks via Sys Schema
While the Performance Schema provides the raw underlying tables (e.g., performance_schema.events_statements_summary_by_digest), querying them directly requires complex math and microsecond conversions. The sys schema acts as an abstraction layer, transforming raw timers into human-readable latency units (picoseconds converted to seconds or milliseconds) and aggregating statistics by query digest.
A. Isolating Top Latency Consumers Across the Entire System
To identify the top 5 query signatures consuming the largest share of total database execution time, query the sys.statement_analysis view. This exposes query normalized forms, total latency, execution counts, and row processing metrics:
SELECT
    query,
    db,
    exec_count,
    total_latency,
    avg_latency,
    rows_examined_avg,
    rows_sent_avg,
    rows_examined_avg / NULLIF(rows_sent_avg, 0) AS examination_ratio,
    first_seen,
    last_seen
FROM sys.statement_analysis
WHERE db NOT IN ('mysql', 'sys', 'performance_schema', 'information_schema')
ORDER BY total_latency DESC
LIMIT 5;examination_ratio (e.g., examining 50,000 rows to return only 10 rows) is a definitive indicator of missing composite indexes or sub-optimal execution plans, forcing the optimizer into unindexed range scans or temporary table allocations.
B. Detecting Full Table Scans and Index Starvation
Unindexed queries degrade overall database throughput by flooding the InnoDB Buffer Pool with raw data pages, evicting frequently accessed index pages. Identify queries executing full table scans using sys.statements_with_full_table_scans:
SELECT
    query,
    db,
    exec_count,
    total_latency,
    no_index_used_count,
    no_good_index_used_count,
    rows_examined
FROM sys.statements_with_full_table_scans
WHERE db NOT IN ('mysql', 'sys')
ORDER BY total_latency DESC
LIMIT 10;
C. Tracking Disk-Spilled Temporary Tables
When MySQL 9 executes complex sorting (ORDER BY), grouping (GROUP BY), or window functions, queries may exceed tmp_table_size and max_heap_table_size, spilling in-memory temporary tables directly to disk (using the TempTable or InnoDB storage engine). Inspect these expensive operations using:
SELECT
    query,
    db,
    exec_count,
    memory_tmp_tables,
    disk_tmp_tables,
    ROUND((disk_tmp_tables / (memory_tmp_tables + disk_tmp_tables)) * 100, 2) AS disk_spill_pct,
    avg_latency
FROM sys.statements_with_temp_tables
WHERE disk_tmp_tables > 0
ORDER BY disk_tmp_tables DESC
LIMIT 10;
5. Deep-Dive: Lock Contention and Wait State Profiling
When query latency spikes occur without a corresponding increase in CPU or disk I/O utilization, the root cause is almost invariably lock contention or metadata lock (MDL) blocking. MySQL 9 provides dedicated views to trace lock waits directly from the transaction and data lock tables.
A. Analyzing InnoDB Row Lock Waits
To inspect active blocking chains where one transaction is stalled behind another holding an exclusive row lock:
SELECT
    r.trx_id AS waiting_trx_id,
    r.trx_mysql_thread_id AS waiting_thread,
    r.trx_query AS waiting_query,
    b.trx_id AS blocking_trx_id,
    b.trx_mysql_thread_id AS blocking_thread,
    b.trx_query AS blocking_query,
    TIMESTAMPDIFF(SECOND, r.trx_wait_started, NOW()) AS wait_duration_seconds
FROM information_schema.innodb_lock_waits w
JOIN information_schema.innodb_trx b ON b.trx_id = w.blocking_trx_id
JOIN information_schema.innodb_trx r ON r.trx_id = w.requesting_trx_id
ORDER BY wait_duration_seconds DESC;
B. Identifying Metadata Locks (MDL)
A long-running SELECT query can silently hold a shared metadata lock, completely stalling subsequent ALTER TABLE, OPTIMIZE TABLE, or DROP TABLE DDL statements. Use the Performance Schema metadata lock table to uncover blocked and blocking threads:
SELECT
    OBJECT_TYPE,
    OBJECT_SCHEMA,
    OBJECT_NAME,
    LOCK_TYPE,
    LOCK_STATUS,
    OWNER_THREAD_ID,
    OWNER_EVENT_ID
FROM performance_schema.metadata_locks
WHERE OBJECT_SCHEMA NOT IN ('mysql', 'sys', 'performance_schema')
ORDER BY OBJECT_NAME, LOCK_STATUS;
6. Memory Footprint and Buffer Pool Telemetry
Memory leaks and uncontrolled buffer growth are critical failure modes in high-concurrency database deployments. MySQL 9’s sys schema provides instant visibility into memory allocations grouped by subsystem and thread:
-- Top global memory consumers by engine component
SELECT
    event_name,
    current_count,
    current_alloc,
    high_alloc
FROM sys.memory_global_by_current_bytes
ORDER BY current_allocated DESC
LIMIT 10;
Furthermore, to evaluate which tables dominate the active InnoDB Buffer Pool and identify caching imbalances:
SELECT
    table_schema,
    table_name,
    allocated,
    data,
    pages,
    pages_hashed,
    pages_old
FROM sys.innodb_buffer_stats_by_table
WHERE table_schema NOT IN ('mysql', 'sys')
ORDER BY allocated DESC
LIMIT 10;
7. Frequently Asked Questions (Actionable FAQs)
Does enabling the Performance Schema in MySQL 9 cause noticeable performance degradation?
When properly tuned, the Performance Schema in MySQL 9 introduces less than 0.8% to 1.5% CPU overhead. Incurring significant overhead only happens if you activate granular wait events (e.g., wait/synch/mutex/sql/% or wait/io/file/%) across all consumers globally on extremely high-throughput OLTP systems. Adhering to the surgical instrument list provided in this guide ensures negligible performance impact while retaining full query digest observability.
What is the key difference between Performance Schema and Sys Schema in MySQL 9?
The Performance Schema is the low-level data collection engine implemented inside the server kernel that populates non-blocking in-memory tables with raw event timers, memory bytes, and thread IDs. The Sys Schema is a collection of views, stored procedures, and functions that sit on top of the Performance Schema and Information Schema, automatically formatting nanoseconds/picoseconds into human-readable time (seconds, ms) and presenting aggregated diagnostic summaries.
How can I clear or reset the collected Performance Schema metrics without restarting MySQL?
You can truncate the history and summary tables dynamically without restarting mysqld. For example, execute TRUNCATE TABLE performance_schema.events_statements_summary_by_digest; to reset statement digest aggregation, or execute CALL sys.ps_truncate_all_tables(FALSE); to reset all summary and history tables while preserving current connection counters.
Why are certain slow queries missing from sys.statement_analysis?
If queries are missing, you may have reached the performance_schema_digests_size limit (default is 1,024 in older installations, 10,000 in our tuned configuration). Once the digest table fills up, new query signatures are lumped into a single generic bucket with a NULL digest. Increasing performance_schema_digests_size ensures every distinct statement fingerprint is tracked.
Ready to Deploy High-Performance Infrastructure?
Experience blazing-fast NVMe storage, unmetered bandwidth, and enterprise LiteSpeed caching on CpanelFree.